|
A SUMMARY OF THE 2011 ANNUAL REPORTS
Social Security and Medicare Boards of Trustees
A MESSAGE TO THE PUBLIC:
Each year the Trustees of the Social Security and Medicare trust funds report on the current and projected financial status
of the two programs. This message summarizes our 2011 Annual Reports.
The financial conditions of the Social Security and Medicare programs remain challenging. Projected long-run program costs
for both Medicare and Social Security are not sustainable under currently scheduled financing, and will require legislative
modifications if disruptive consequences for beneficiaries and taxpayers are to be avoided.
The long-run financial challenges facing Social Security and Medicare should be addressed soon. If action is taken sooner rather
than later, more options and more time will be available to phase in changes so that those affected have adequate time to
prepare. Earlier action will also afford elected officials with a greater opportunity to minimize adverse impacts on vulnerable
populations, including lower-income workers and those who are already substantially dependent on program benefits.
Both Social Security and Medicare, the two largest federal programs, face substantial cost growth in the upcoming decades due
to factors that include population aging as well as the growth in expenditures per beneficiary. Through the mid-2030s, due
to the large baby-boom generation entering retirement and lower-birth-rate generations entering employment, population aging
is the largest single factor contributing to cost growth in the two programs. Thereafter, the continued rapid growth in health
care cost per beneficiary becomes the larger factor.
Social Security
Social Security expenditures exceeded the program’s non-interest income in 2010 for the first time since 1983. The $49 billion
deficit last year (excluding interest income) and $46 billion projected deficit in 2011 are in large part due to the weakened
economy and to downward income adjustments that correct for excess payroll tax revenue credited to the trust funds in earlier
years. This deficit is expected to shrink to about $20 billion for years 2012-2014 as the economy strengthens. After 2014, cash
deficits are expected to grow rapidly as the number of beneficiaries continues to grow at a substantially faster rate than the
number of covered workers. Through 2022, the annual cash deficits will be made up by redeeming trust fund assets from the
General Fund of the Treasury. Because these redemptions will be less than interest earnings, trust fund balances will continue
to grow. After 2022, trust fund assets will be redeemed in amounts that exceed interest earnings until trust fund reserves are
exhausted in 2036, one year earlier than was projected last year. Thereafter, tax income would be sufficient to pay only about
three-quarters of scheduled benefits through 2085.
Under current projections, the annual cost of Social Security benefits expressed as a share of workers’ taxable wages will grow
rapidly from 11-1/2 percent in 2007, the last pre-recession year, to roughly 17 percent in 2035, and will then dip slightly
before commencing a slow upward march after 2050. Costs display a slightly different pattern when expressed as a share of GDP.
Program costs equaled roughly 4.2 percent of GDP in 2007, and are projected to increase gradually to 6.2 percent of GDP in
2035 and then decline to about 6.0 percent of GDP by 2050 and remain at about that level.
The projected 75-year actuarial deficit for the combined Old-Age and Survivors Insurance and Disability Insurance (OASDI) Trust
Funds is 2.22 percent of taxable payroll, up from 1.92 percent projected in last year’s report. This deficit amounts to 17
percent of tax receipts, and 14 percent of program outlays.
The 0.30 percentage point increase in the OASDI actuarial deficit and the one-year advance in the exhaustion date for the
combined trust funds primarily reflects lower estimates for death rates at advanced ages, a slower economic recovery than
was assumed last year, and the one-year advance of the valuation period from 2010-2084 to 2011-2085.
While the combined OASDI program continues to fail the long-range test of close actuarial balance, it does satisfy the conditions
for short-range financial adequacy. Combined trust fund assets are projected to exceed one year’s projected benefit payments
for more than ten years, through to 2035. However, the Disability Insurance (DI) program satisfies neither the long-range nor
short-range tests for financial adequacy. DI costs have exceeded non-interest income since 2005 and trust fund exhaustion is
projected for 2018; thus changes to improve the financial status of the DI program are needed soon.
Medicare
Relative to the combined Social Security Trust Funds, the Medicare HI Trust Fund faces a more immediate funding shortfall,
though its longer term financial outlook is better under the assumptions employed in this report.
Medicare costs (including both HI and SMI expenditures) are projected to grow substantially from approximately 3.6 percent of GDP in
2010 to 5.5 percent of GDP by 2035, and to increase gradually thereafter to about 6.2 percent of GDP by 2085.
The projected 75-year actuarial deficit in the HI Trust Fund is 0.79 percent of taxable payroll, up from 0.66 percent projected
in last year’s report. The HI fund fails the test of short-range financial adequacy, as projected assets drop below one year’s
projected expenditures early in 2011. The fund also continues to fail the long-range test of close actuarial balance. Medicare’s
HI Trust Fund is expected to pay out more in hospital benefits and other expenditures than it receives in income in all future
years. The projected date of HI Trust Fund exhaustion is 2024, five years earlier than estimated in last year’s report, at
which time dedicated revenues would be sufficient to pay 90 percent of HI costs. The share of HI expenditures that can be
financed with HI dedicated revenues is projected to decline slowly to 75 percent in 2045, and then to rise slowly, reaching
88 percent in 2085. Over 75 years, HI’s actuarial imbalance is estimated to be equivalent to 21 percent of tax receipts or
17 percent of program outlays.
The worsening of HI's projected finances is primarily due to lower HI real (inflation-adjusted) non-interest income caused by a
slower assumed economic recovery, and by higher HI real costs caused by higher assumed near-term growth in real economy-wide
average labor compensation. The resulting increases in HI real deficits are concentrated in the near term, which is why trust
fund exhaustion occurs five years earlier than was projected last year despite a relatively modest increase in the 75-year
actuarial deficit.
Part B of Supplementary Medical Insurance (SMI), which pays doctors’ bills and other outpatient expenses, and Part D, which provides
access to prescription drug coverage, are both projected to remain adequately financed into the indefinite future because current
law automatically provides financing each year to meet the next year’s expected costs. However, the aging population and rising
health care costs will cause SMI costs to grow rapidly from 1.9 percent of GDP in 2010 to approximately 3.4 percent of GDP in
2035 and approximately 4.1 percent of GDP by 2085. Roughly three-quarters of these costs will be financed from general revenues
and about one-quarter from premiums paid by beneficiaries. Small amounts of SMI financing are received from special payments
by States and from fees on manufacturers and importers of brand-name prescription drugs.
Projected Medicare costs over 75 years are about 25 percent lower because of provisions in the Patient Protection and Affordable
Care Act, as amended by the Health Care and Education Reconciliation Act of 2010 (the "Affordable Care Act" or ACA). Most of
the ACA-related cost saving is attributable to a reduction in the annual payment updates for most Medicare services (other than
physicians’ services and drugs) by total economy multifactor productivity growth, which is projected to average 1.1 percent per
year. The report notes that the long-term viability of this provision is debatable. In addition, an almost 30-percent reduction
in Medicare payment rates for physician services is assumed to be implemented in 2012, notwithstanding experience to the contrary.
The drawdown of Social Security and HI trust fund reserves and the general revenue transfers into SMI will result in mounting
pressure on the Federal budget. In fact, pressure is already evident. For the sixth consecutive year, a "Medicare funding
warning" is being triggered, signaling that projected non-dedicated sources of revenues -- primarily general revenues -- will
soon account for more than 45 percent of Medicare’s outlays. That threshold was in fact breached for the first time in
fiscal 2010. A Presidential proposal is required by law in response to the latest warning..
Conclusion
Projected long-run program costs for both Medicare and Social Security are not sustainable under currently scheduled financing,
and will require legislative corrections if disruptive consequences for beneficiaries and taxpayers are to be avoided.
The financial challenges facing Social Security and Medicare should be addressed soon. If action is taken sooner rather than
later, more options and more time will be available to phase in changes so that those affected can adequately prepare.
By the Trustees:
Timothy F. Geithner,
Secretary of the Treasury,
and Managing Trustee |
Hilda L. Solis,
Secretary of Labor,
and Trustee |
|
|
Kathleen Sebelius,
Secretary of Health
and Human Services,
and Trustee |
Michael J. Astrue,
Commissioner of
Social Security,
and Trustee |
|
|
Charles P. Blahous III,
Trustee
| Robert D. Reischauer,
Trustee
|
A SUMMARY OF THE 2011 ANNUAL SOCIAL SECURITY
AND MEDICARE TRUST FUND REPORTS
Projected long-range costs for both Medicare and Social Security are not sustainable under currently scheduled financing and
will require legislative corrections if disruptive consequences for beneficiaries and taxpayers are to be avoided. If action is
taken sooner rather than later, more options and time will be available to phase in changes, giving those affected adequate time
to prepare. Earlier action will also afford policymakers greater opportunity to minimize adverse impacts on vulnerable
populations, including lower-income workers and those who are substantially dependent on program benefits.
What Are the Trust Funds?
Congress established trust funds in the U.S. Treasury to account for Social Security and Medicare income and disbursements.
Social Security and Medicare taxes, premiums, and other income are credited to the funds. There are four separate trust funds.
For Social Security, the Old-Age and Survivors Insurance (OASI) Trust Fund pays retirement and survivors benefits and the
Disability Insurance (DI) Trust Fund pays disability benefits. (The two trust funds are often considered on a combined basis
designated OASDI.) For Medicare, the Hospital Insurance (HI) Trust Fund pays for inpatient hospital and related care. The
Supplementary Medical Insurance (SMI) Trust Fund comprises two separate accounts: Part B, which pays for physician and
outpatient services, and Part D, which covers the prescription drug benefit.
Disbursements from the funds can be made only to pay program benefits and administrative costs. All excess funds must
be invested in interest-bearing securities backed by the full faith and credit of the United States.
The Department of the Treasury currently invests all program revenues in special non-marketable securities of the U.S.
Government on which a market rate of interest is credited. The trust funds represent the accumulated value, including
interest, of all prior program annual surpluses and deficits, and provide automatic authority to pay benefits.
What Were the Trust Fund Results in 2010?
In December 2010, 43.8 million people received OASI benefits, 10.2 million received DI benefits, and 47.5 million were covered
under Medicare. Trust fund operations, in billions of dollars, are shown below (totals may not add due to rounding). The OASI
Trust Fund showed a net increase in assets in 2010; DI, HI, and SMI Trust Fund assets declined.
| | OASI | DI |
HI | SMI |
| Assets (end of 2009) |
$2,336.8 |
$203.5 |
$304.2 |
$76.6 |
| Income during 2010 |
677.1 |
104.0 |
215.6 |
270.4 |
| Outgo during 2010 |
584.9 |
127.7 |
247.9 |
274.9 |
| Net increase in assets |
92.2 |
-23.6 |
-32.3 |
-4.5 |
| Assets (end of 2010) |
2,429.0 |
179.9 |
271.9 |
72.1 |
What Were the Sources of Income to the Trust Funds in 2010?
The following table shows income, by source, to each trust fund in 2010 (totals may not add due to rounding)
| Source (in billions) |
OASI |
DI |
HI |
SMI |
| Payroll taxes |
$544.8 |
$92.5 |
$182.0 |
— |
| General revenues |
— |
— |
0.1 |
$204.6 |
| General Fund reimbursements |
2.0 |
0.4 |
— |
— |
| Interest earnings |
108.2 |
9.3 |
13.8 |
3.1 |
| Beneficiary premiums |
— |
— |
3.3 |
58.4 |
| Taxes on benefits |
22.1 |
1.9 |
13.8 |
— |
| Transfers from States |
— |
— |
— |
4.0 |
| Other |
a |
— |
2.7 |
.2 |
| Total |
677.1 |
104.0 |
215.6 |
270.4 |
a Less than $50 million.
What is the Long-Range (2011-85) Outlook for Social Security and Medicare Costs?
An instructive way to view the projected cost of Social Security and Medicare is to compare the cost of all scheduled benefits
for the two programs with the gross domestic product (GDP), the most frequently used measure of the total output of the U.S.
economy (Chart A)
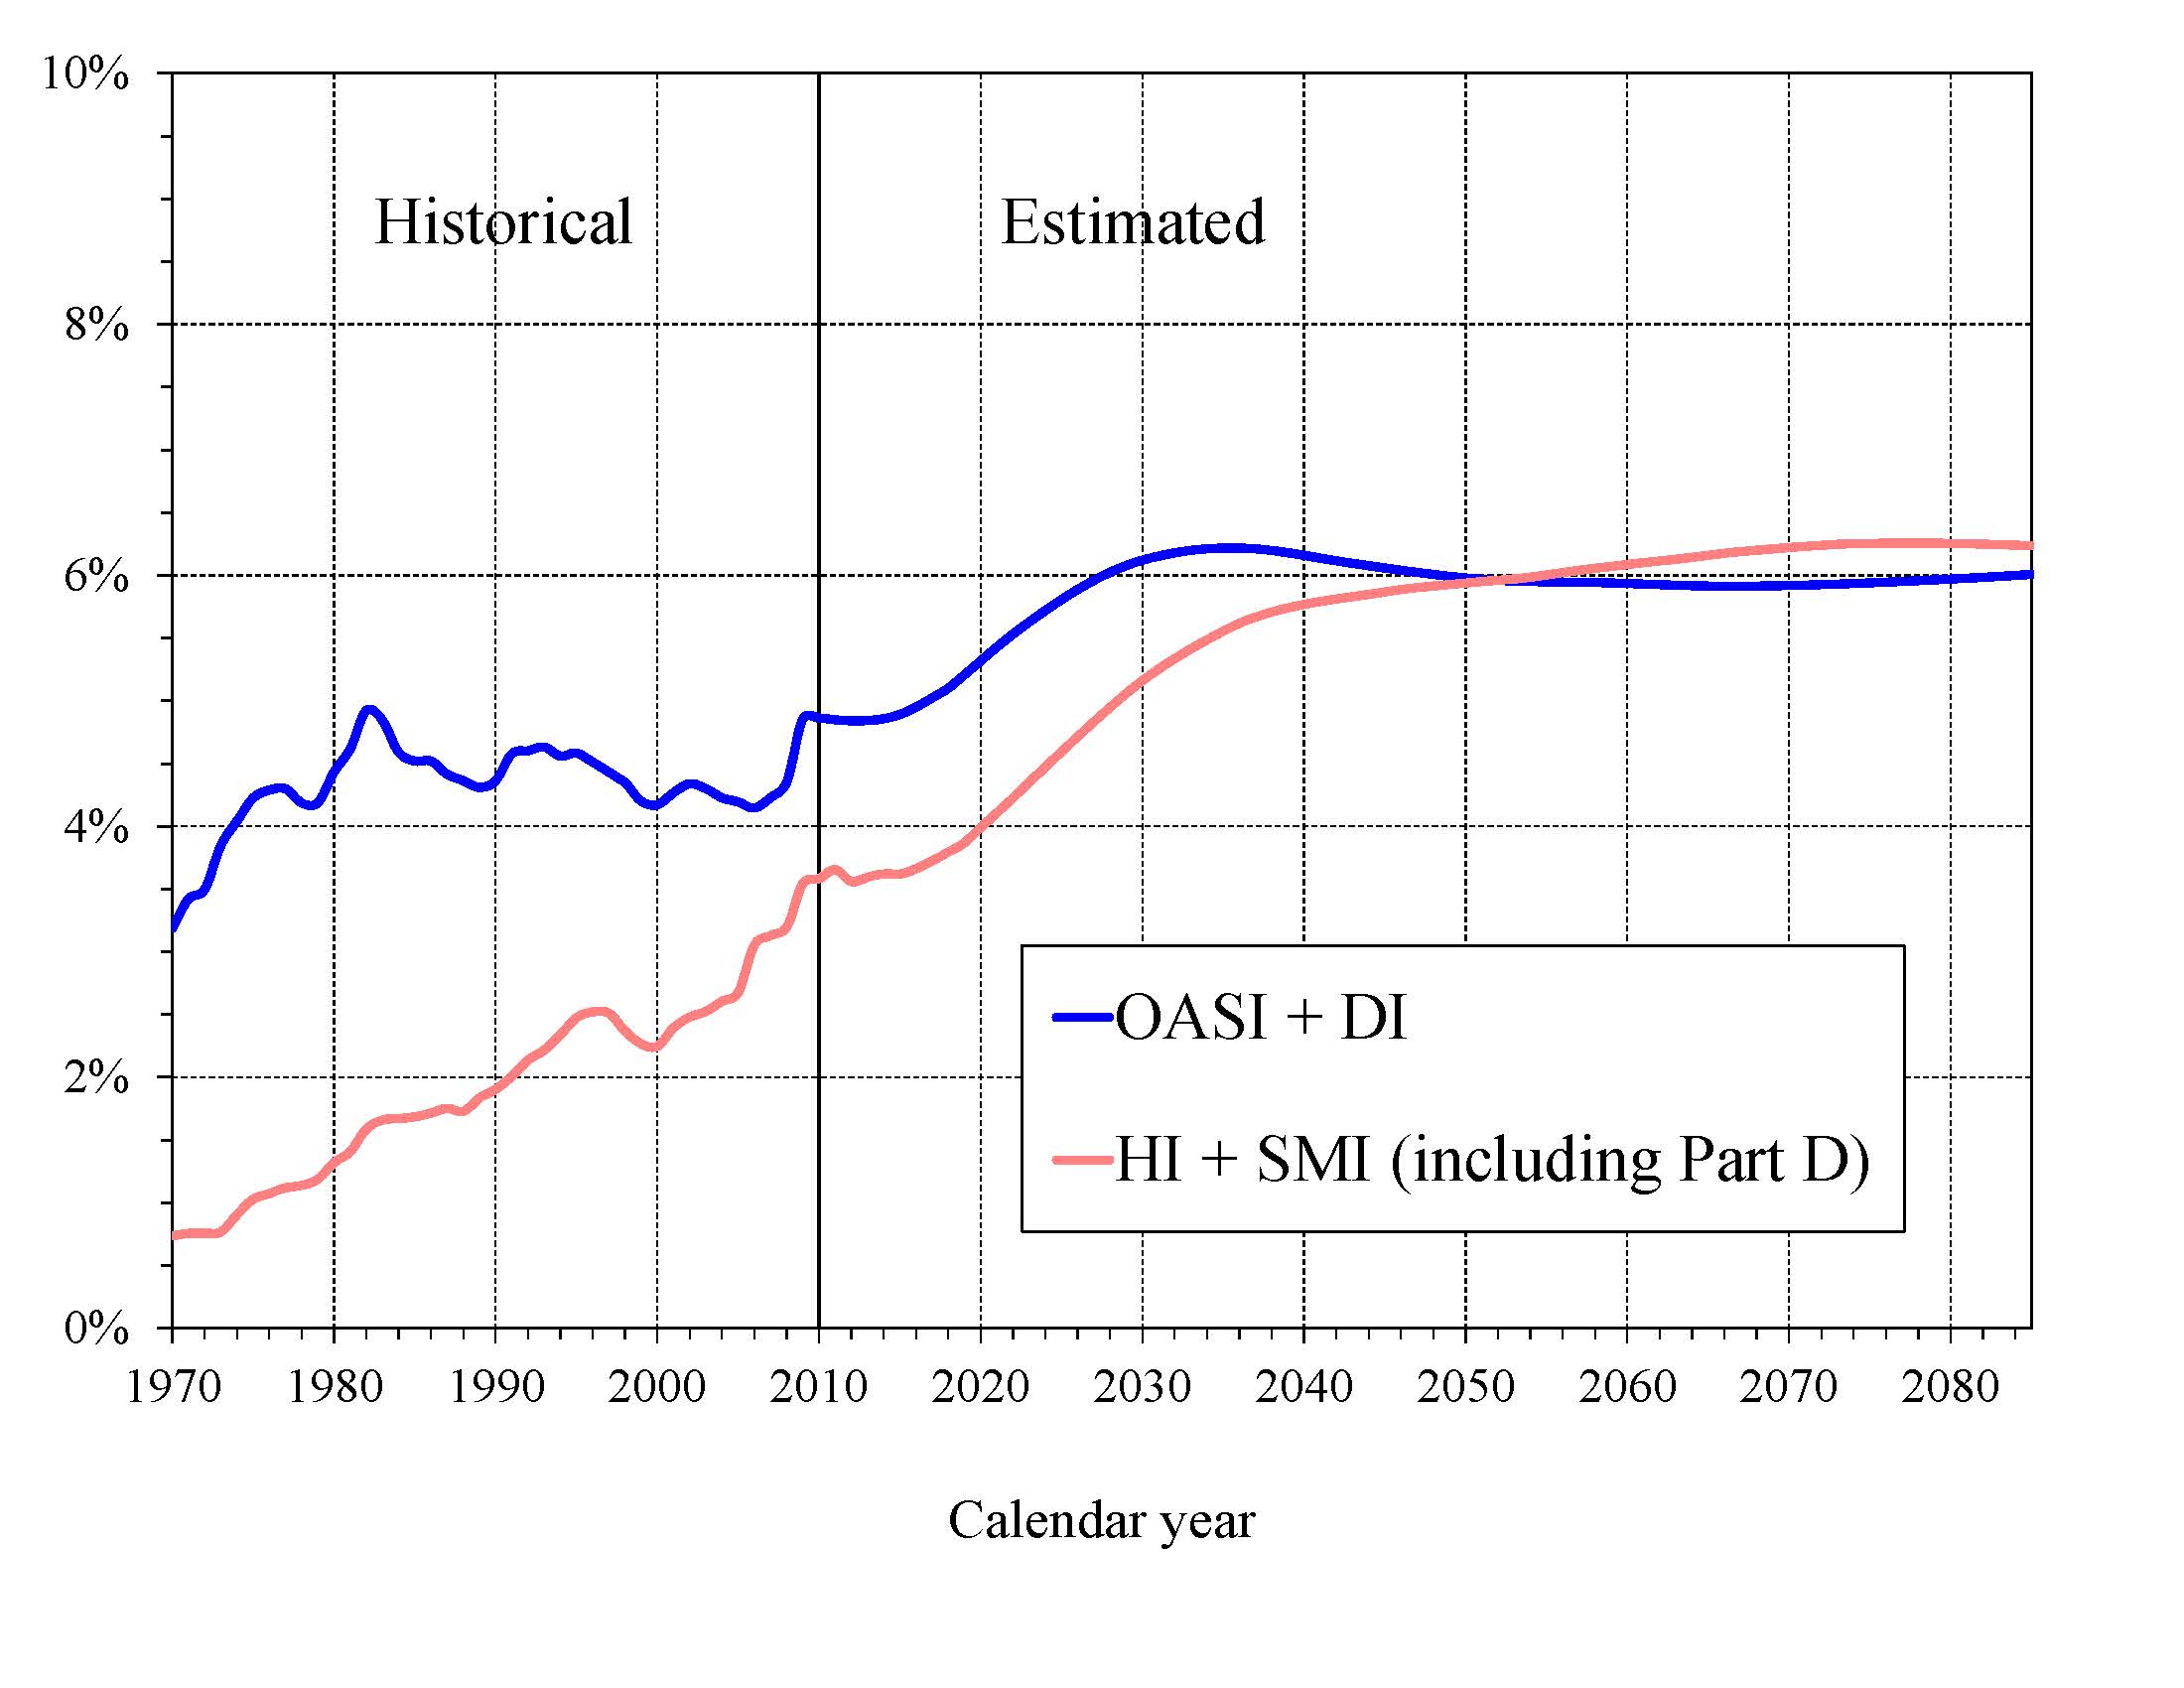
Chart A—Social Security and Medicare Cost as a Percentage of GDP
|
Costs for both programs increase substantially through 2035 because (1) the number of beneficiaries rises rapidly as the
baby-boom generation retires and (2) the lower birth rates that have persisted since the baby boom cause slower growth of
both the labor force and GDP. Social Security’s projected annual cost increases to about 6.2 percent of GDP in 2035,
declines to 6.0 percent by 2050, and remains at about that level through 2085. Under current law, projected Medicare cost
increases to 5.6 percent of GDP by 2035, reaching 6.2 percent in 2085, driven in the latter period largely by the rising
cost of health care services per beneficiary. These projected costs may well be exceeded because they are based on the
assumptions that the deep reductions in physician fees required by the sustainable growth rate system are not waived by
legislation and the Affordable Care Act’s reduced provider payment updates are sustainable over the long run.
In 2010, the combined cost of the Social Security and Medicare programs equaled 8.4 percent of GDP, and is projected to increase
to 11.8 percent of GDP by 2035, reaching 12.2 percent of GDP by 2085. Although Medicare cost (3.6 percent of GDP) was smaller
than Social Security cost (4.9 percent of GDP) in 2010, the gap is expected to close gradually, with the costs being very similar
after 2050.
The projected costs for OASDI and HI depicted in Chart A and elsewhere in this document reflect the full cost of scheduled
current-law benefits without regard to whether the benefits would be fully payable. Current law precludes payment of any benefits
beyond the amount that can be financed by the trust funds, therefore the amount of benefits that could be payable in years after
trust fund exhaustion is lower than shown, as described later in this summary.
How Will Social Security and Medicare HI Costs Grow in Future Years in Relation to Taxable Earnings?
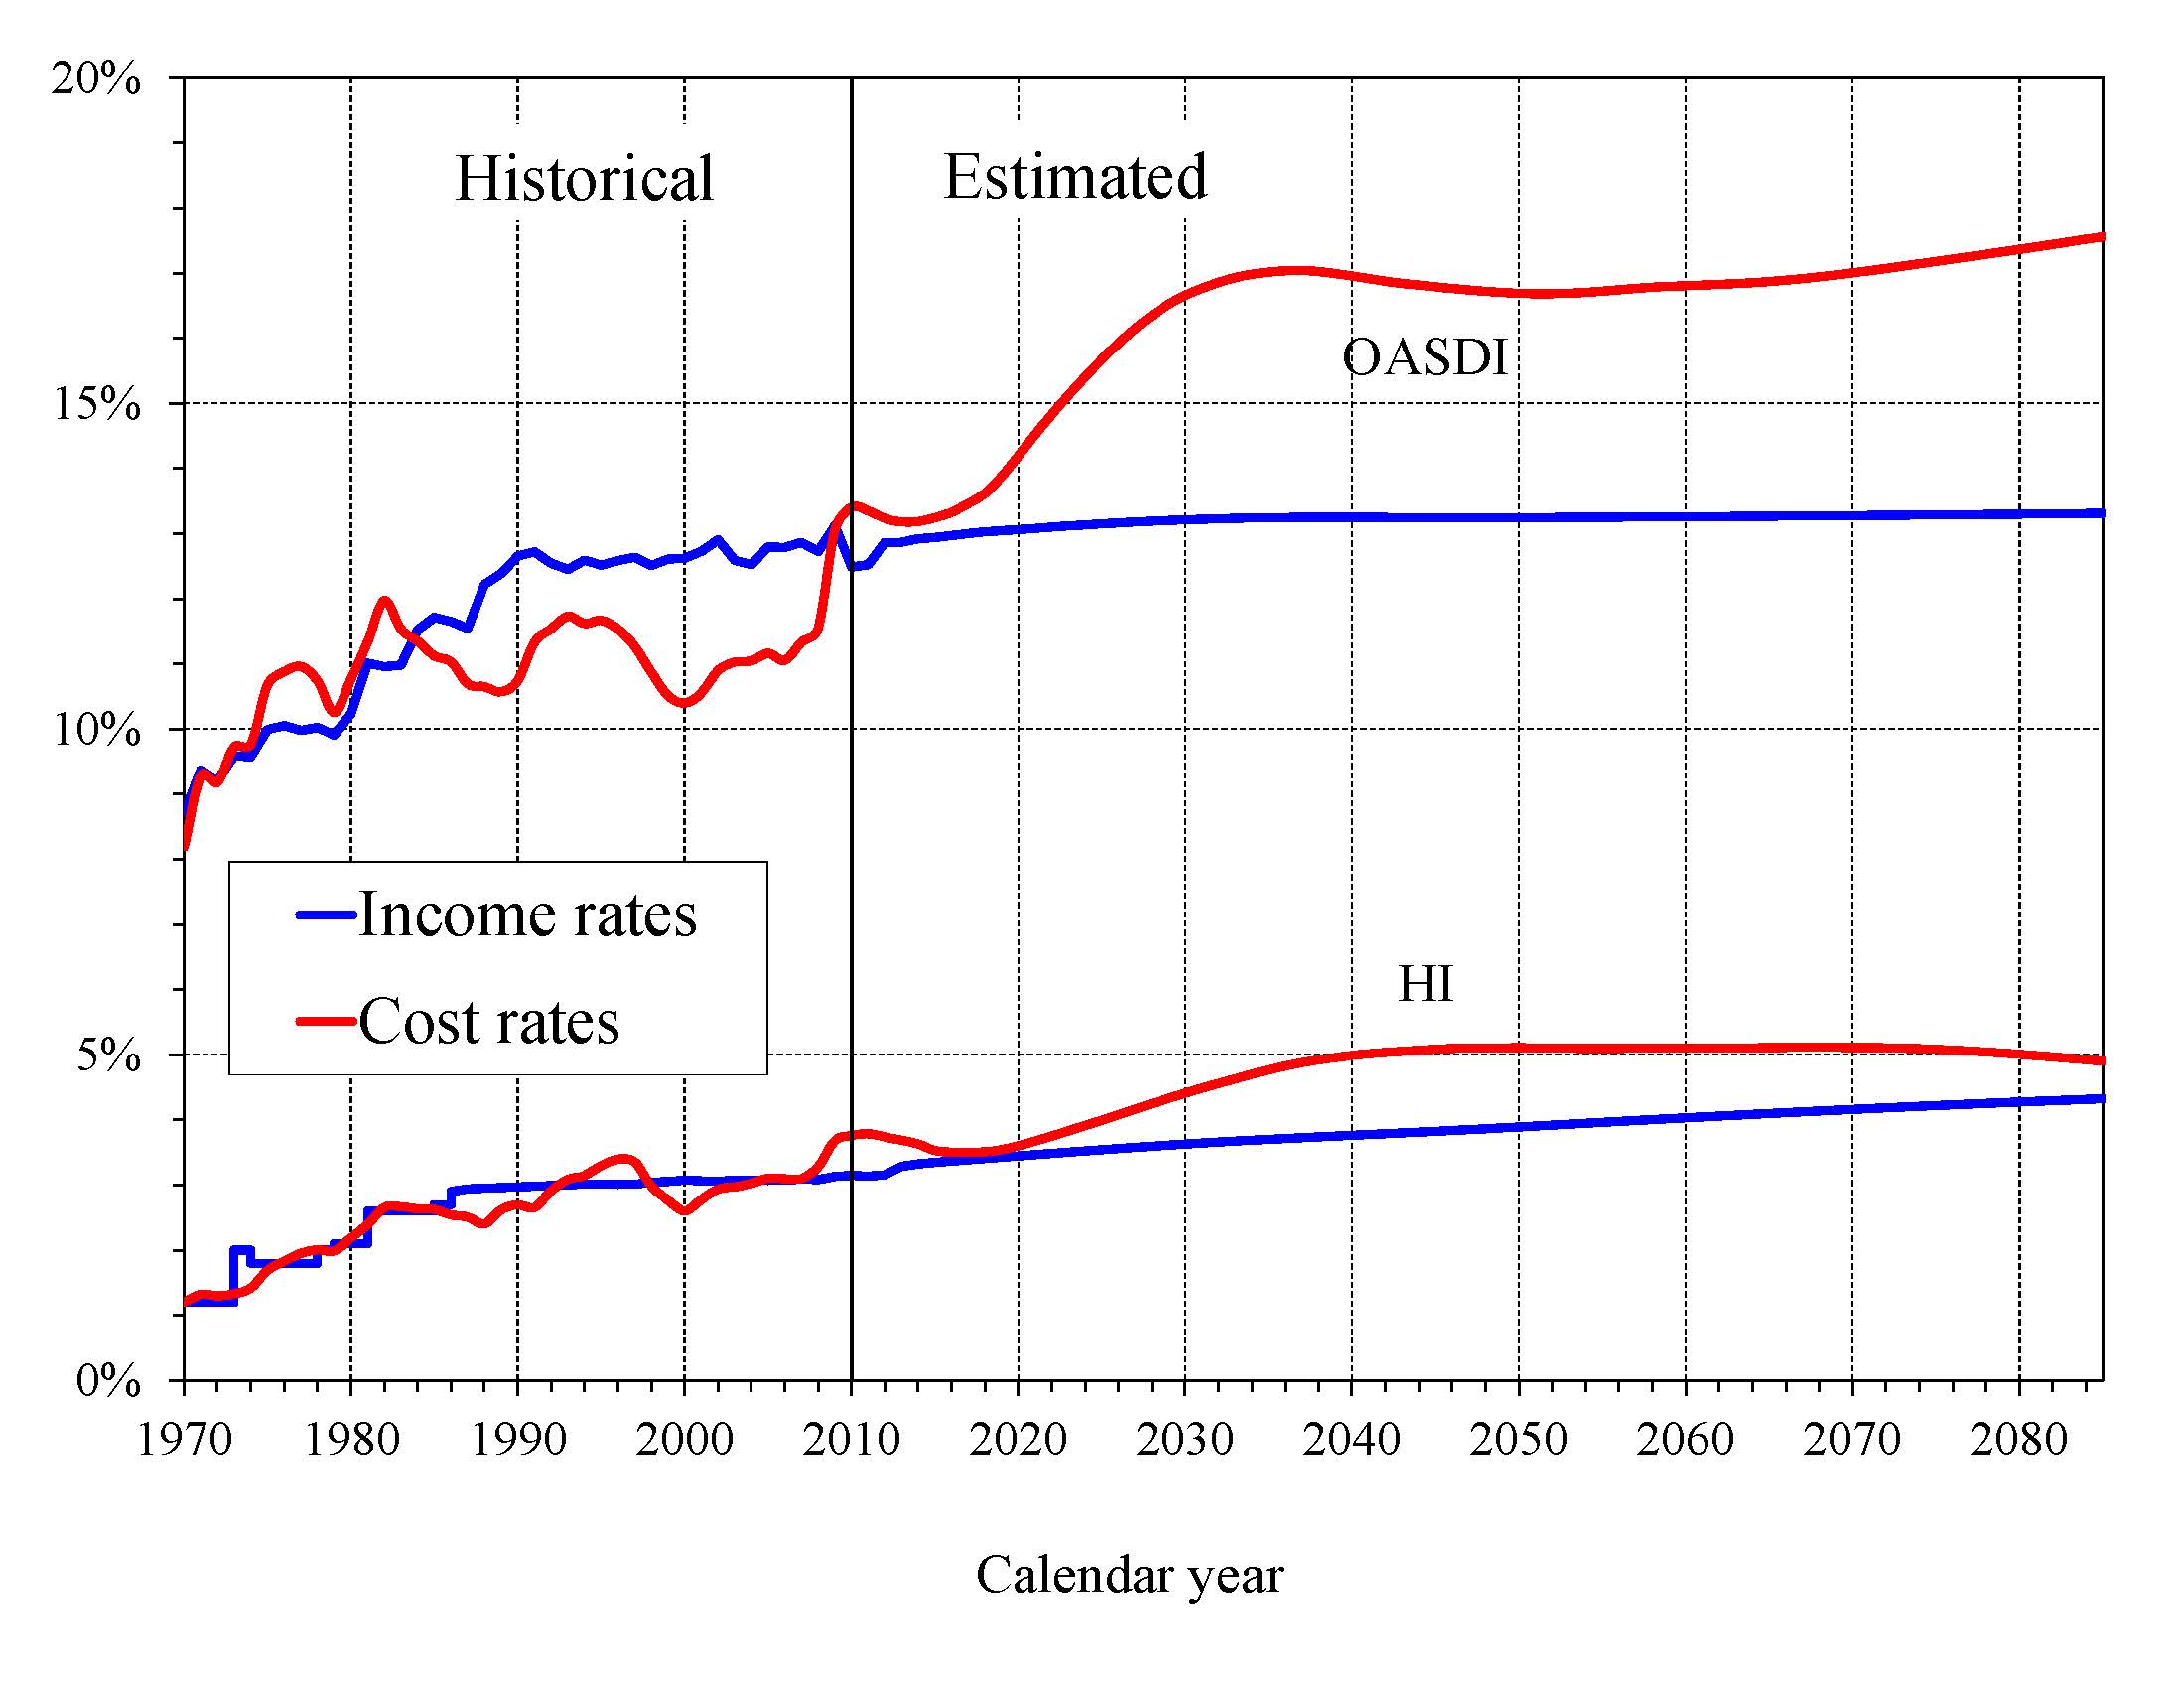
Because the primary source of income for OASDI and HI is the payroll tax, it is customary to compare the programs’ non-interest
income and costs expressed as percentages of taxable payroll, the “income rate” and “cost rate” shown in Chart B. Both the
OASDI and HI annual cost rates increase over the long run from their 2010 levels (13.40 and 3.76 percent). Projected Social
Security costs grow to 17.01 percent of taxable payroll by 2035, decline to 16.69 percent in 2050, and then rise gradually
thereafter, reaching 17.56 percent in 2085. Medicare HI costs rise to 5.11 percent of taxable payroll in 2049 and level off
thereafter under the intermediate assumptions employed in this report, with an ultimate cost rate of 4.90 in 2085
The OASDI income rate, estimated at 12.52 percent in 2011, increases little over time, reaching 13.31 in 2085. Payroll tax
rates are scheduled to remain unchanged from their 1990 levels (with the exception of temporary reductions in the tax rates
for 2010 and 2011 that are offset by reimbursements from the General Fund of the Treasury). Annual income from the other
tax source, the taxation of OASDI benefits, will increase gradually relative to taxable payroll as a greater proportion of
Social Security benefits is subject to taxation in future years, but will continue to be a relatively small component of
program income.
Chart B—Income and Cost Rates
(Percentage of taxable payroll)
|
The projected HI income rate rises gradually from 3.14 in 2011 to 4.32 in 2085 due to the Affordable Care Act’s increase in
payroll tax rates for high earners starting in 2013. Individual tax return filers with earnings above $200,000, and joint
return filers with earnings above $250,000, will pay an additional 0.9 percent tax on earnings above these earnings thresholds.
An increasing fraction of earnings will be subject to the higher tax rate over time because the thresholds are not indexed.
How Do the Sources of Medicare Financing Change as Costs Grow?
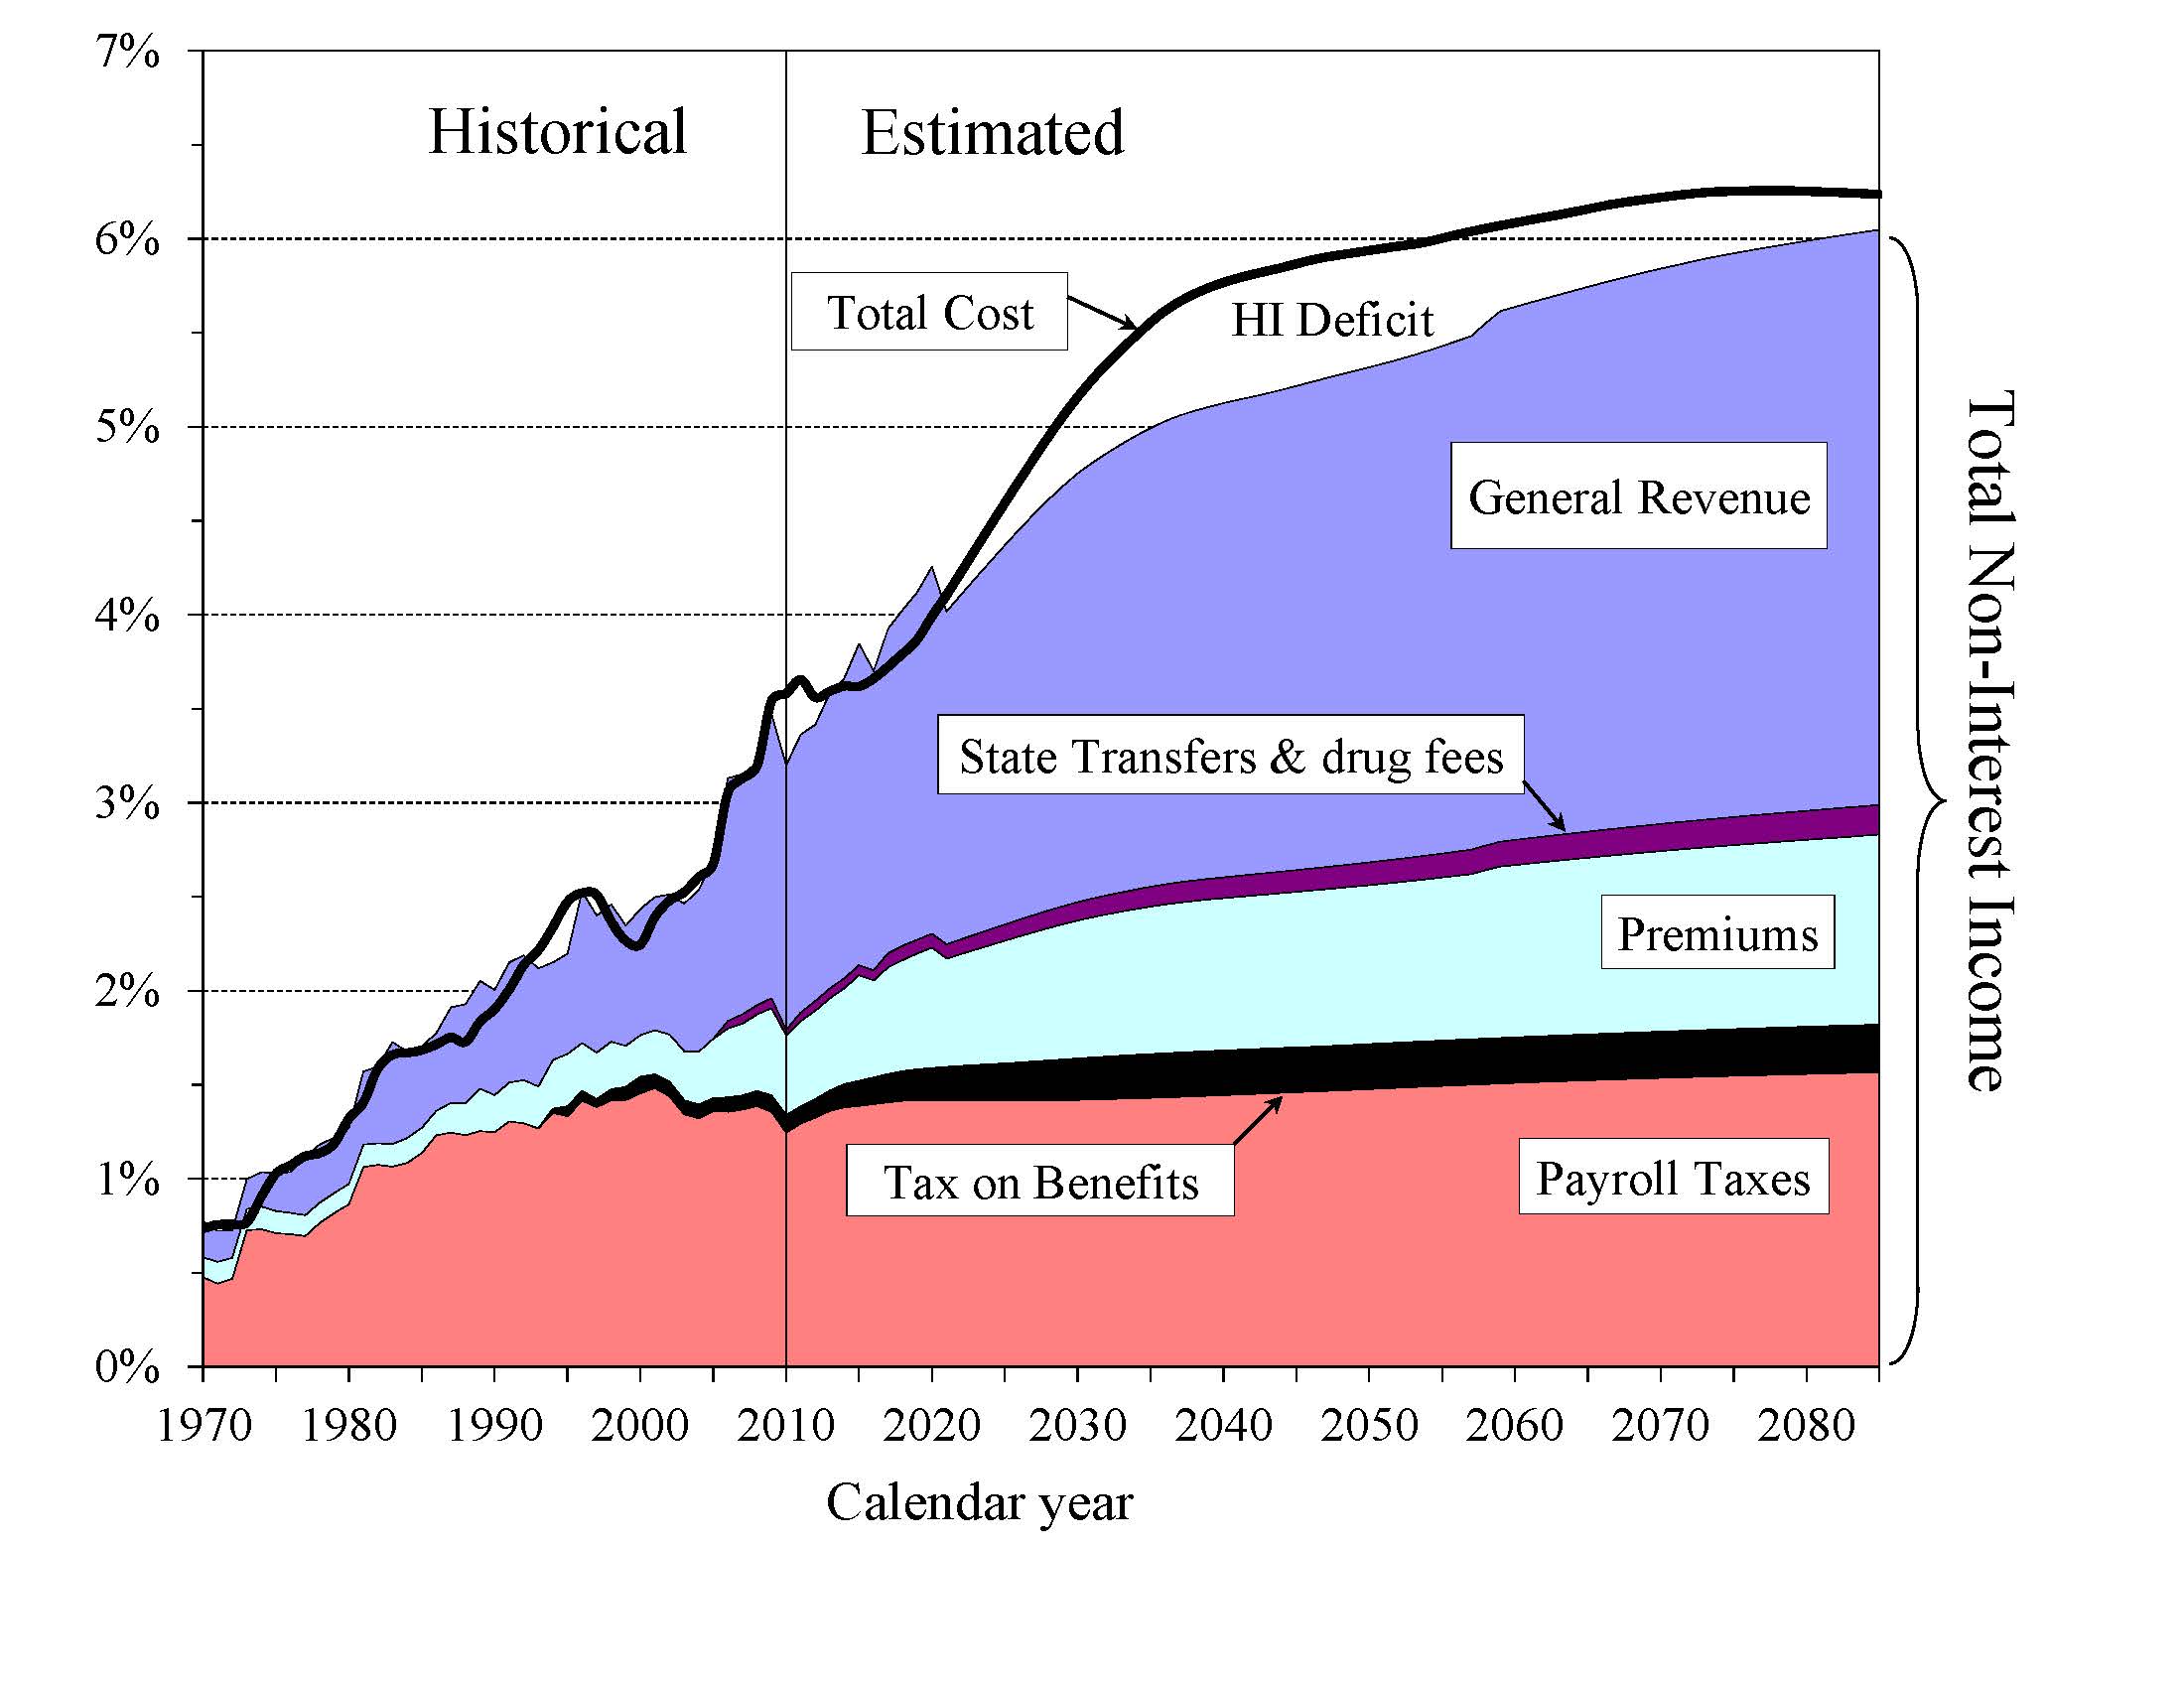
As Medicare costs grow over time, general revenue and beneficiary premiums will play an increasing role in financing the program.
Chart C shows current-law scheduled cost and current-law non-interest revenue sources for HI and SMI combined as a percentage
of GDP. The total cost line is the same as displayed in Chart A and shows Medicare cost rising to 6.2 percent of GDP by 2085.
Projected revenue from payroll taxes and taxes on OASDI benefits credited to the HI Trust Fund increases from 1.4 percent of
GDP in 2011 to 1.8 percent in 2085 under current law, while projected general revenue transfers to the SMI Trust Fund increase
from 1.5 percent of GDP in 2011 to 3.1 percent in 2085, and beneficiary premiums increase from 0.5 to 1.0 percent of GDP. The
share of total non-interest Medicare income from taxes would fall substantially (from 41 percent to 30 percent) while general
revenue transfers would rise (from 44 to 51 percent), as would premiums (from 13 percent to 17 percent). The distribution of
financing changes because Part B and D costs increase at a faster rate than Part A cost, while Part B and D financing keeps
pace with cost growth and Part A financing does not. By 2085, the Medicare SMI program will require general revenue transfers
equal to 3.1 percent of GDP. Moreover, the HI deficit represents a further 0.2 percent of GDP in 2085 and there is no
current-law provision to finance this deficit through general revenue transfers or any other revenue source.
Chart C—Medicare Cost and Non-Interest Income by Source as a Percentage of GDP
|
The Medicare Modernization Act (2003) requires that the Board of Trustees determine each year whether the annual difference
between program outlays and dedicated revenues (the bottom four layers of Chart C) exceeds 45 percent of total Medicare
outlays in any of the first seven fiscal years of the 75-year projection period. In effect, the law sets a threshold condition
that signals that a trust fund’s general revenue financing of Medicare is becoming excessive. In that case, the annual Trustees
Report includes a determination of "excess general revenue Medicare funding." When that determination is made in two consecutive
reports, a "Medicare funding warning" is triggered. The warning directs the President to submit proposed legislation within 15
days of the next budget submission to respond to the warning and requires Congress to consider the proposal on an expedited basis.
This year’s report projects the difference between outlays and dedicated financing revenues to exceed 45 percent of total
Medicare outlays during fiscal year 2011, prompting a determination of "excess general revenue Medicare funding" for the sixth
consecutive report, triggering another "Medicare funding warning."
What Are Key Dates in Long-Range OASI, DI, and HI Financing?
For HI, non-interest income fell short of expenditures in 2010, as it has since 2008, and the HI fund used interest income
($14 billion) and assets ($32 billion) to help finance expenditures. This report anticipates a $34 billion deficit for 2011
due to lower estimated HI tax revenues and continued HI expenditure growth, followed by a period of declining deficits (2012-18)
as the growth in taxable earnings accelerates. Because the annual HI deficits in this year’s report are higher than estimated
in 2010, the projected drawdown of HI Trust Fund assets is accelerated until the trust fund is exhausted in 2024 (five years
earlier compared to last year’s report), after which tax income would be sufficient to pay 90 percent of HI costs, declining
to 76 percent in 2050, and then increasing to 88 percent by 2085.
In 2011, OASDI annual cost will exceed the sum of tax income plus General Fund reimbursements (for payroll tax revenue forgone
under Public Laws 111-147 and 111-312) by an estimated $46 billion, the second consecutive year in which non-interest income has
fallen short of cost. Nevertheless, the combined trust funds will continue to grow because projected interest earnings of $115
billion substantially exceed the non-interest income deficit. The report indicates that annual OASDI income, including payments
of interest to the trust funds from the General Fund, will exceed annual cost every year until 2023, increasing the nominal
value of combined OASDI trust fund assets. Beginning in 2023, net redemptions of trust fund assets with General Fund payments
will be required until assets are exhausted in 2036. After trust fund exhaustion, continuing tax income would be sufficient to
pay 77 percent of scheduled benefits in 2036 and 74 percent in 2085. When the programs are considered separately, the projected
exhaustion date for the OASI Trust Fund is 2038, while that for the DI Trust Fund is 2018. Payment of full DI benefits
beyond 2018 will require legislation to address the financial imbalance, such as a reallocation of the OASDI payroll tax rate
between OASI and DI.
The key dates regarding cash flows are shown in the following table.
KEY DATES FOR THE TRUST FUNDS
| |
OASI |
DI |
OASDI |
HI |
| First year outgo exceeds income excluding interesta |
2017 |
2005 |
2010 |
2008 |
| First year outgo exceeds income including interesta |
2025 |
2009 |
2023 |
2008 |
| Year trust funds are exhausted |
2038 |
2018 |
2036 |
2024 |
a Dates indicate the first year that a condition is projected to occur and to persist annually thereafter through 2085.
What is the Outlook for Short-Term Trust Fund Adequacy?
The reports measure the short-range adequacy of the OASI, DI, and HI Trust Funds by comparing fund assets to projected costs for
the ensuing year (the "trust fund ratio"). A trust fund ratio of 100 percent or more -- that is, assets at least equal to projected
costs for a year -- is a good indicator of a fund’s short-range adequacy. That level of projected assets for any year means that
even if cost exceeds income, the trust fund reserves, combined with annual tax revenues, would be sufficient to pay full
benefits for several years.
By this measure, the OASI Trust Fund is financially adequate throughout the 2011-20 period, but the DI Trust Fund fails the
short-range test because its projected trust fund ratio falls to 90 percent by the beginning of 2013, followed by exhaustion of
assets in 2018. Furthermore, despite the increasing nominal value of the OASI and combined OASDI trust funds throughout the
short-range period, both the OASI and DI trust fund ratios -- indicators of the duration of continuing benefit payments that the
trust funds could finance out of current assets -- will continue to decline from 2011 forward.
The HI Trust Fund also does not meet the short-range test of financial adequacy; its projected trust fund ratio falls to 86
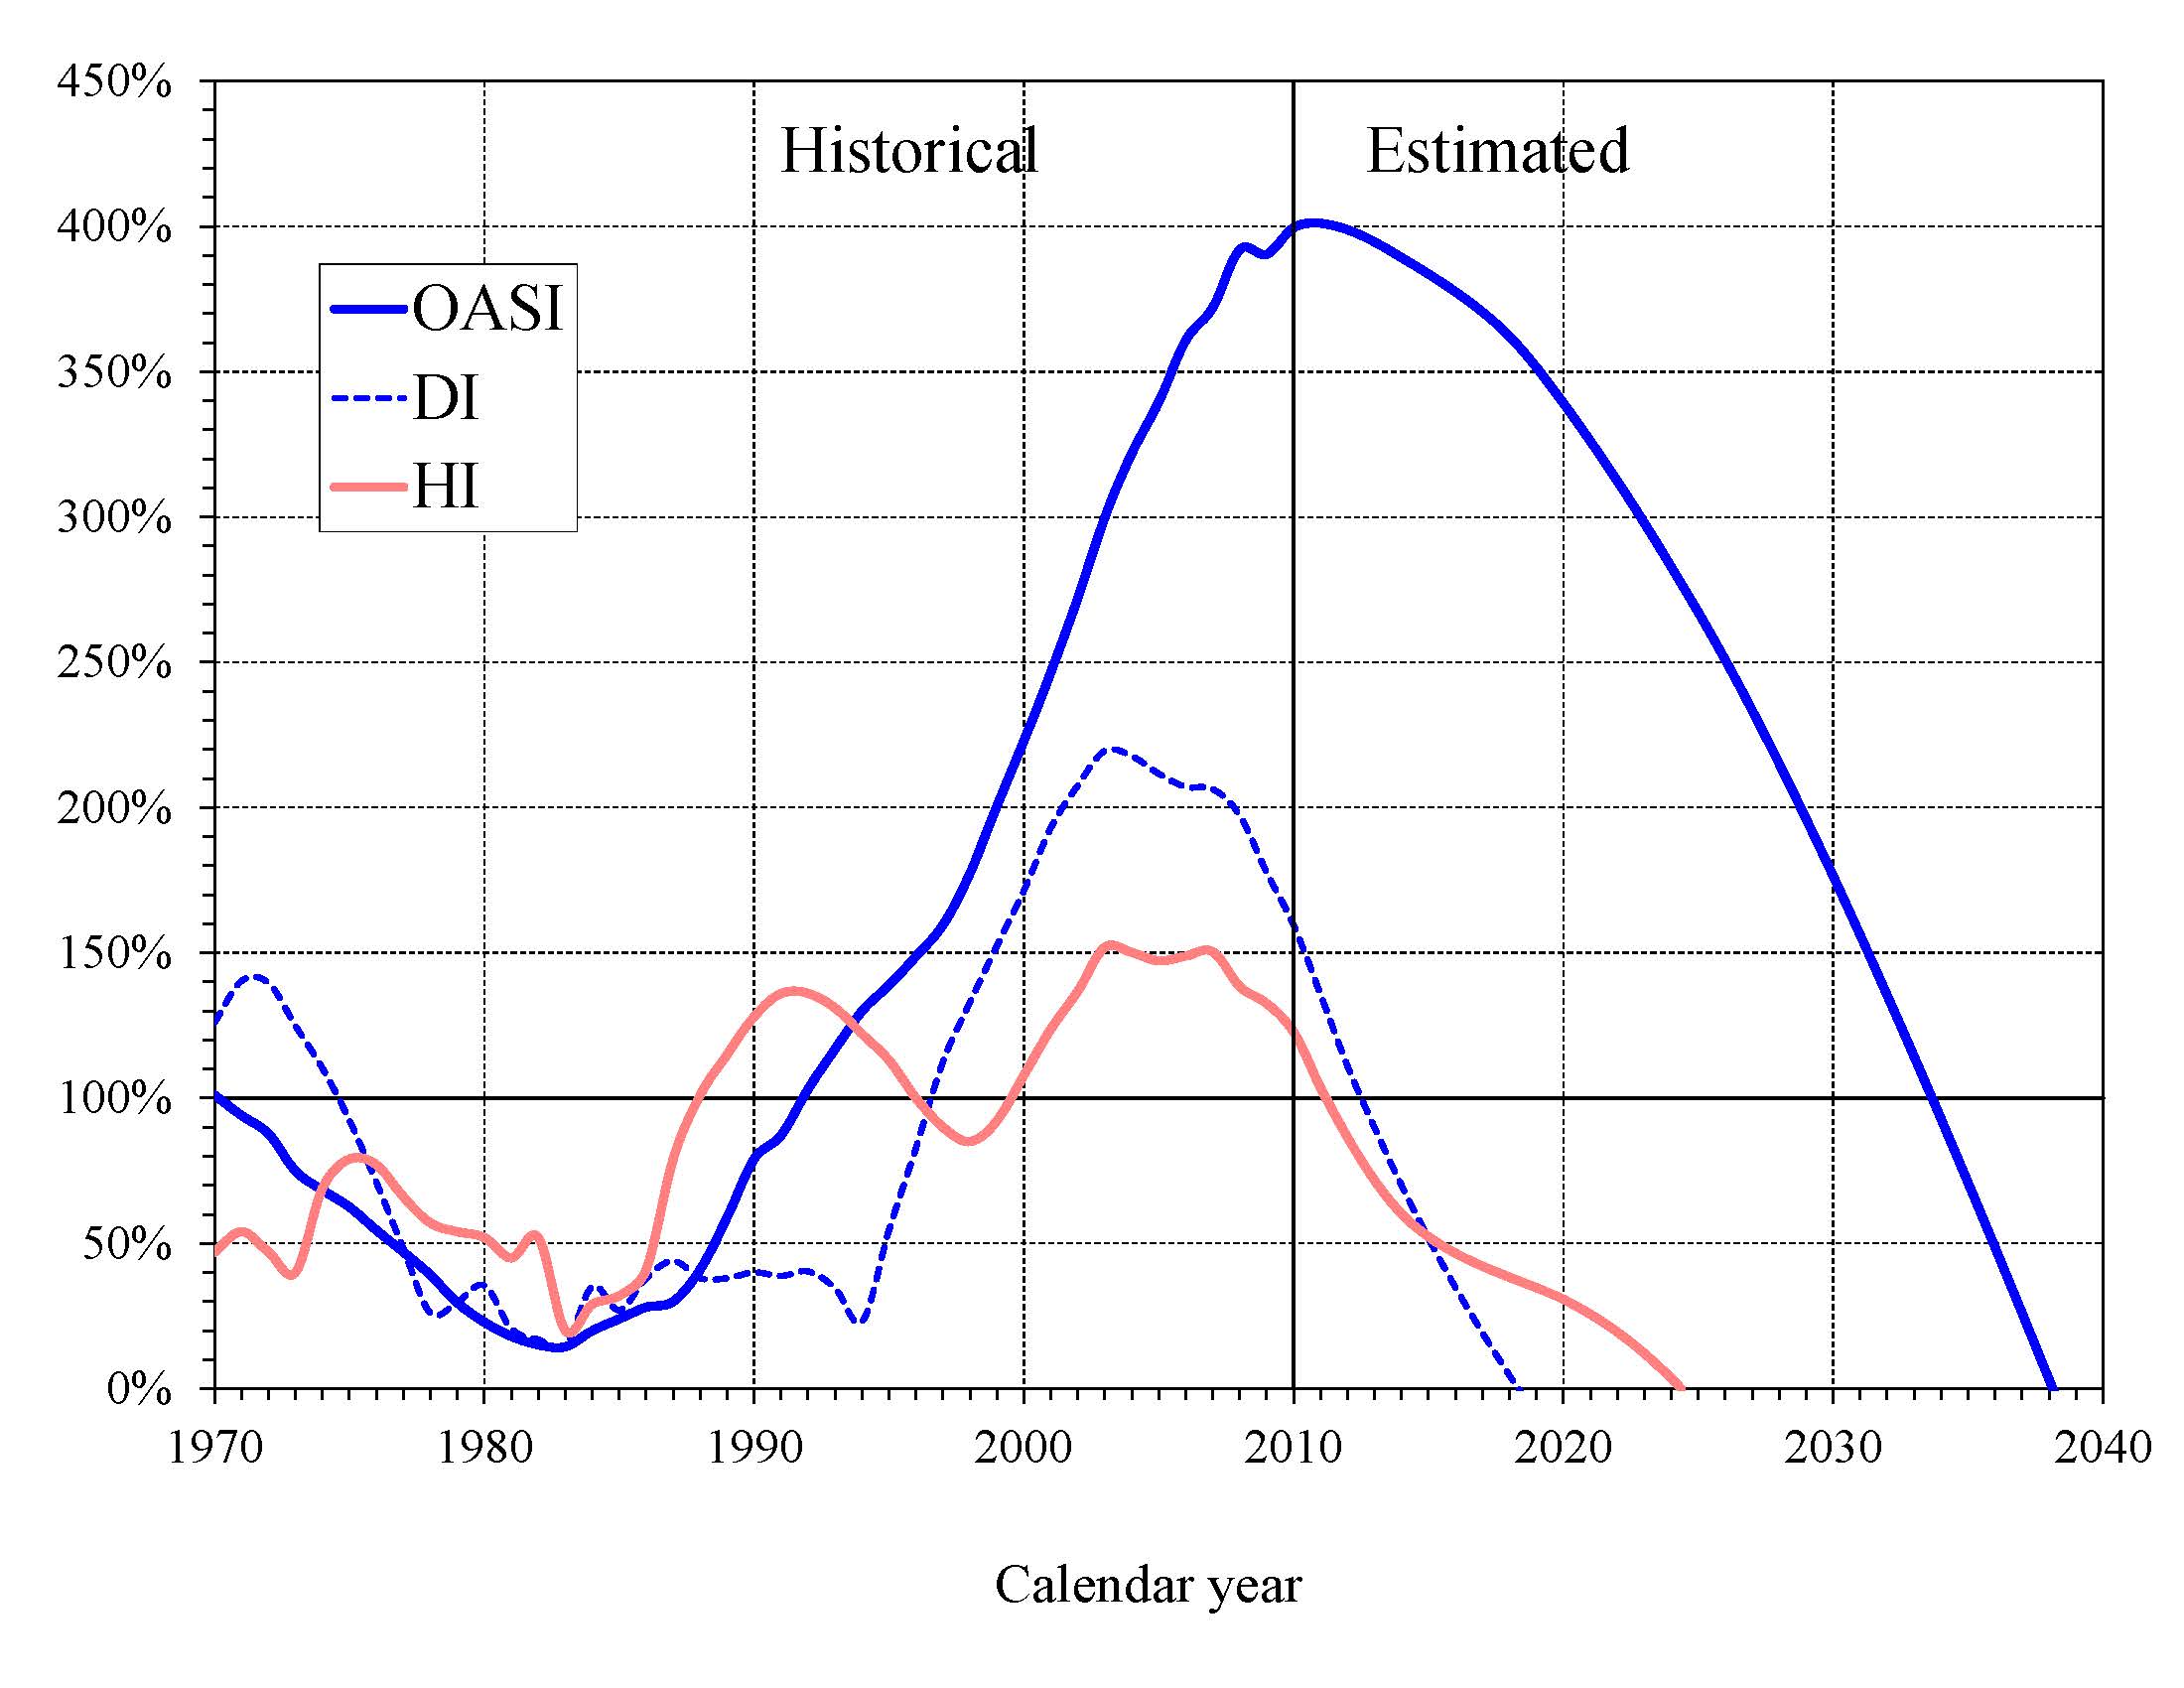
percent by the beginning of 2012. Projected HI Trust Fund assets are fully depleted in 2024. Chart D shows the trust fund
ratios through 2040 under the intermediate assumptions.
A less stringent annual "contingency reserve" test is applied to SMI Part B assets since the overwhelming portion of the
financing for that account consists of beneficiary premiums and general revenue contributions that are set each year to meet
expected costs. Part D is similarly financed on an annual basis. Moreover, the operation of Part D through private insurance
plans, together with a flexible appropriation for Federal costs, eliminates the need for a contingency reserve in that account.
Note, however, that estimated Part B costs are improbably low for 2012 and beyond because the projections assume that
current law, which substantially reduces physician payments per service under the sustainable growth rate system, will
not be changed. The estimated physician fee reduction for 2012 is 29 percent. A reduction in fees of this magnitude is
highly unlikely; Congress has acted to prevent smaller reductions in every year since 2003. Underestimated payments to
physicians would affect projected costs for Part B, total SMI, and total Medicare.
Chart D—OASI, DI, and HI Trust Fund Ratios
(Assets as a percentage of annual cost)
|
A "hold-harmless" provision in the law, applicable to most Part B enrollees, limits the premium increase to the dollar amount of
the beneficiary’s Social Security COLA increase. Thus, zero COLAs for December 2009 and December 2010 prevented premiums for
most Part B enrollees from increasing in 2010 and 2011 beyond the 2009 premium amount of $96.40, while a higher standard
premium was paid by or paid on behalf of some beneficiaries for whom the "hold harmless" did not apply. This year’s report
projects a small COLA for December 2011, which will again result in some enrollees paying less than the standard premium in 2012.
The following table shows the projected income and outgo, and the change in the balance of each trust fund (except for SMI),
over the next 10 years. SMI income and expenditures are shown in separate columns for Parts B and D. Changes in the SMI Trust
Fund are not shown since program income is set each year to meet the following year’s projected cost.
ESTIMATED OPERATIONS OF TRUST FUNDS
(In billions—totals may not add due to rounding)
| |
Income |
Expenditures |
Change in fund |
| | SMI |
| SMI |
|
| Year |
OASI |
DI |
HI |
B |
D |
OASI |
DI |
HI |
B |
D |
OASI |
DI |
HI |
| 2011 |
$701 |
$107 |
$229 |
$234 |
$67 |
$606 |
$133 |
$263 |
$228 |
$67 |
$95 |
($26) |
($34)
|
| 2012 |
753 |
114 |
244 |
242 |
76 |
633 |
139 |
275 |
221 |
76 |
120 |
-25 |
-32
|
| 2013 |
796 |
119 |
262 |
272 |
85 |
670 |
144 |
288 |
234 |
85 |
126 |
-25 |
-25
|
| 2014 |
846 |
124 |
281 |
295 |
91 |
712 |
149 |
301 |
252 |
91 |
134 |
-25 |
-20
|
| 2015 |
894 |
130 |
297 |
338 |
100 |
757 |
154 |
308 |
268 |
100 |
136 |
-24 |
-11
|
|
|
| 2016 |
943 |
136 |
314 |
319 |
110 |
806 |
159 |
322 |
284 |
110 |
138 |
-24 |
-8
|
| 2017 |
994 |
141 |
331 |
370 |
120 |
858 |
165 |
337 |
303 |
120 |
136 |
-24 |
-6
|
| 2018 |
1,049 |
a |
350 |
403 |
131 |
915 |
172 |
355 |
324 |
131 |
133 |
a |
-6
|
| 2019 |
1,102 |
a |
367 |
440 |
142 |
981 |
179 |
375 |
347 |
142 |
121 |
a |
-8
|
| 2020 |
1,155 |
a |
385 |
486 |
157 |
1,053 |
188 |
399 |
376 |
157 |
102 |
a |
-14 |
aThe DI Trust Fund is projected to be exhausted in 2018 under the intermediate assumptions. Certain trust fund operation values from 2018 forward are not meaningful under current law and are not shown in this table.
What is the Long-Range Actuarial Balance of the OASI, DI, and HI Trust Funds?
Another way to view the outlook for payroll tax-financed trust funds is in terms of their actuarial balances for the 75-year
valuation period. The actuarial balance of a fund is essentially the difference between annual income and costs, expressed as a
percentage of taxable payroll, summarized over the 75-year projection period. Because SMI is brought into balance annually
through premium increases and general revenue transfers, actuarial balance is not an informative concept for that program.
The OASI, DI, and HI Trust Funds all have long-range actuarial deficits under the intermediate assumptions, as shown in the
following table.
LONG-RANGE ACTUARIAL DEFICIT OF THE OASI, DI, AND HI TRUST FUNDS
(As a percentage of taxable payroll)
| |
OASI |
DI |
OASDI |
HI |
| Actuarial deficit |
1.92 |
0.30 |
2.22 |
0.79 |
The actuarial deficit can be interpreted as the percentage points that could be either added to the current-law income rate or
subtracted from the cost rate for each of the next 75 years to bring the funds into actuarial balance. An actuarial balance of
zero is achieved if trust fund assets at the end of the period are equal to the following year’s cost. Note that Social
Security’s annual deficits, expressed as the difference between the cost rate and income rate, are projected to increase
gradually from 2015 to 2038, decline slightly during 2039-52, and then resume increasing through 2085 (Chart B). Increasing
annual deficits during the final three decades of the projection indicate that a single tax rate increase for all years
starting in 2011 sufficient to achieve actuarial balance would result in large annual surpluses early in the period followed
by increasing deficits in later years. The relatively large deficits at the end of the 75-year projection period -- equal to 4.24
percent of taxable payroll in 2085 (see Chart B discussion) -- indicate that sustained solvency would require payroll tax rate
increases or benefit reductions (or a combination thereof) by the end of the period that are substantially larger than those
needed on average for this report’s long-range period (2011-85).
In contrast with the combined OASDI Trust Fund, projected HI Trust Fund annual deficits decline during the final 40 years of
the 75-year valuation period, assuming that the Affordable Care Act’s mandated cost savings are realized. As discussed more
fully in the report, this outcome is uncertain because health care providers may be unable to adapt successfully to the lower
rate of payment increases called for by the Affordable Care Act.
The projected actuarial deficit in each of these programs is large enough that continued solvency under current-law financing
is extremely unlikely. A supplementary analysis that allows plausible random variations from the intermediate assumptions
employed in the report indicates that OASDI trust fund exhaustion is highly probable by mid-century.
How Has the Financial Outlook for Social Security and Medicare Changed Since Last Year?
Under the intermediate assumptions, the combined OASDI Trust Funds have a projected 75-year actuarial deficit equal to 2.22
percent of taxable payroll, 0.30 percentage point larger than last year’s estimate. The anticipated asset exhaustion date moves
closer by one year to 2036. The increased OASDI shortfall has multiple causes, the largest of which is lower recent and
projected mortality rates for the population age 65 and older. Lower levels of short-range net immigration, lower real earnings
due to a slower-than-anticipated recovery from the recent recession, and the inclusion of 2085 (a year with a large negative
balance) in the 75-year projection period also contribute to the higher long-range deficit.
Medicare’s HI Trust Fund has a long-range actuarial deficit equal to 0.79 percent of taxable payroll under the intermediate
assumptions, larger than the 0.66 percent figure reported last year. HI Trust Fund balances are lower due to higher projected
expenditures and lower levels of taxable payroll in 2010 and throughout the projection period. The HI Trust Fund exhaustion date
moves closer by five years from 2029 to 2024. Actual HI taxable earnings in 2010 were considerably lower than previously
estimated, and the projected level of real (inflation-adjusted) HI taxes remains lower than in last year’s report, although
the difference narrows throughout the current decade as the economy recovers from the recent recession.
Who Are the Trustees?
There are six Trustees, four of whom serve by virtue of their positions in the Federal Government: the Secretary of the
Treasury, the Secretary of Labor, the Secretary of Health and Human Services, and the Commissioner of Social Security.
The other two Trustees are public representatives appointed by the President and confirmed by the Senate: Charles P.
Blahous III, Research Fellow at the Hoover Institution, and Robert D. Reischauer, President of the Urban Institute.
How Are Social Security and Medicare Financed?
For OASDI and HI, the major source of financing is payroll taxes on earnings that are paid by employees and their employers.
Self-employed workers are charged the equivalent of the combined employer and employee tax rates. During 2010, an estimated 156
million people had earnings covered by Social Security and paid payroll taxes; for Medicare the corresponding figure was 160
million. The payroll tax rates are set by law and for OASDI apply to earnings up to an annual maximum ($106,800 in 2011) that
ordinarily increases with the growth in the nationwide average wage. When the cost-of-living adjustment (COLA) for December
of any year is zero, as occurred in both 2009 and 2010, the maximum taxable amount of earnings does not increase for the
following year, thereby reducing OASDI taxes paid by higher earners. COLA increases are expected to return in December 2011
and beyond. In contrast to OASDI, covered workers pay HI taxes on total earnings. The scheduled payroll tax rates
(in percent) are:
| |
OASI |
DI |
OASDI |
HI |
Total |
| Employees |
5.30 |
0.90 |
6.20 |
1.45 |
7.65 |
| Employers |
5.30 |
0.90 |
6.20 |
1.45 |
7.65 |
| Combined total |
10.60 |
1.80 |
12.40 |
2.90 |
15.30 |
Note two caveats concerning these rates. Public Law 111-312 reduces the OASDI tax rate for 2011 by 2 percentage points for
employees and for self-employed workers. The loss of payroll tax revenue due to this one-year reduction will be made up by
transfers from the General Fund of the Treasury to the OASI and DI Trust Funds and will thus have no financial impact on
either program. Furthermore, starting in 2013, the Affordable Care Act imposes an additional HI tax equal to 0.9 percent
of earnings over $200,000 for individual tax return filers, and on earnings over $250,000 for joint return filers.
Payments from the General Fund finance about 75 percent of SMI Part B and Part D costs, with most of the remaining costs
covered by monthly premiums charged to enrollees. Part B and Part D premium amounts are based on methods defined in law
and increase as the estimated costs of those programs rise.
In 2011, the Part B standard monthly premium paid by about one-quarter of enrollees is $115.40. Under a "hold-harmless"
provision, about three quarters of Part B enrollees in 2010 and 2011 paid or are paying the 2009 premium rate of $96.40 due
to the zero Social Security COLA for those years. There is also an income-related premium surcharge for Part B beneficiaries
whose modified adjusted gross income exceeds a specified threshold. In 2011, the initial threshold is $85,000 for individual
tax return filers and $170,000 for joint return filers. Income-related premiums range from $161.50 to $369.10 per month in 2011.
In 2011, the Part D "base monthly premium" is $32.34. Actual premium amounts charged to Part D beneficiaries depend on the
specific plan in which they are enrolled and are expected to average around $31 for standard coverage. Beginning in 2011,
Part D enrollees with incomes exceeding the thresholds listed above must pay an income-related monthly adjustment amount in
addition to their normal plan premium. For 2011, the adjustments range from $12.00 to $69.10 per month. Part D also receives
payments from States that partially compensate for the Federal assumption of Medicaid responsibilities for prescription drug
costs for individuals eligible for both Medicare and Medicaid. In 2011, State payments should cover about 10 percent of Part
D costs.
A MESSAGE FROM THE PUBLIC TRUSTEES
We were sworn in as Public Trustees in the fall of 2010. Thus, preparation of the 2011 Trustees Reports represents our
first opportunity to participate in the Trustees' annual projection and reporting process. Because we joined the process
in midstream, we agreed with the other Trustees that it would be best if the 2011 reports were consistent, both
methodologically and stylistically, with prior reports. With input from two Technical Review Panels currently assessing
the assumptions underlying the Social Security and Medicare projections, we and the other Trustees will be reviewing these
issues more fully after the release of the 2011 reports and incorporating any agreed-upon changes into the reports for 2012.
The Trustees’ projections change each year, by small, moderate, or significant amounts, as the underlying economic and
demographic assumptions are modified, new legislation is enacted, administrative practices are revised, and projection
methodologies are refined. Notwithstanding the updates that will take place in the future, certain fundamental conclusions
are inescapable and will almost certainly remain so as long as current policies continue unchanged. The most important of
these conclusions is that both the Social Security and Medicare programs face substantial financial shortfalls that will require
significant legislative action to address. A corollary of this finding is that the longer such legislative corrections
are delayed, the more adverse the consequences will be for those who will bear the costs of closing these imbalances. The
remainder of this message addresses the causes, severity, and certainty of these shortfalls -- and the costly consequences
of further delay
Under current law, demographic trends will be the primary driver of cost growth for both Social Security and Medicare over the
next couple of decades. The leading edge of the large baby boom generation began signing up for retirement benefits in 2008
and Medicare coverage in 2011. This generation will dramatically increase the number of program beneficiaries through the
mid-2030s, while also living longer than previous generations and having produced fewer children than did their own parents.
Accordingly, combined Social Security and Medicare costs, which amounted to 7.4 percent of GDP in 2007 (the last year in
which the ratio of program costs to GDP was not strongly influenced by the recent recession), are projected to rise to 11.8
percent of GDP by 2035. More than 90 percent of combined cost growth in Social Security and Medicare from 2007 through 2085
relative to GDP will have occurred by 2035 under current projections. This rapid cost growth for Social Security and Medicare
represents the greatest financial challenge facing these programs as well as the most important reason that delaying legislative
corrections would be increasingly disruptive.
The financial shortfalls confronting both Social Security and Medicare are substantial and -- absent legislation to correct
them -- quite certain. From a trust fund financing perspective, Social Security faces the larger actuarial shortfall of the
two programs -- 2.22 percent of taxable payroll over 75 years -- and its financial shortfall remains qualitatively more certain
even as critical underlying assumptions are changed. A statistical analysis contained in this year’s report shows that,
even allowing for considerable variation in economic and demographic assumptions, there was no scenario within a 95-percent
confidence interval in which Social Security would avoid trust fund exhaustion past mid-century.
Cost projections for Medicare are much less certain than for Social Security over both the short and long term. In the short run,
there is the question of whether the steep reductions in physician payments called for by current law, and assumed in the report’s
projections, will occur or will be waived by legislation, as has been the case for the past several years. Over the longer run,
assumptions regarding the growth of health care costs are central to projections of Medicare’s long-term financial outlook. These
assumptions are inevitably highly uncertain. New technologies and interventions will continue to expand the capabilities of medicine
and to affect the cost of health care in ways that are difficult to predict. Private stakeholders are redoubling their efforts to curb
cost growth, but the extent of their success and the effects of these endeavors on Medicare’s costs are yet to be determined. Also
unknown is how effective the significant federal health legislation enacted in 2010 will be at moderating cost growth for Medicare.
If the legislation’s cost-reducing innovations in the delivery of and payment for health services were not successful, or if health
care providers could not accommodate the slower growth in Medicare payment rates mandated by the new law, Medicare costs would be
significantly higher than shown in the Trustees Report.
Our current projections indicate, however, that even if the recent legislation’s cost-saving measures are sustainably
implemented, Medicare will still experience a financing shortfall that will require further legislation to address. Under
these projections, the HI Trust Fund will become exhausted in 2024, and the 75-year actuarial shortfall for HI is 0.79 percent
of taxable payroll. Medicare’s SMI Trust Fund is automatically replenished annually with sufficient general revenues and
beneficiary premiums to avoid insolvency. Consequently, rising SMI costs increase fiscal pressure on the unified federal budget
and burdens on beneficiaries. Over time, general revenue contributions are projected to more than double, from 1.5 percent of
GDP today to 3.1 percent by 2085, and the fraction of beneficiaries’ incomes devoted to SMI premiums will grow.
Interactions between the Social Security and Medicare programs on the one hand and the larger federal budget on the other are
inevitably and appropriately subjects of public discussion and debate. Whether viewed from the narrower trust fund perspective
or from the wider unified budget perspective, the financial challenges confronting both programs must be addressed. From the
trust fund perspective, both programs face projected shortfalls that necessitate correction sooner rather than later if balance
is to be restored without large, abrupt benefit reductions or tax increases. From the wider budget perspective each program
poses challenges as well. These are manifested in the growing general revenue requirements of Medicare SMI and in the annual
shortfalls of dedicated revenues for both programs, which will entail increased borrowing from the public, reduced spending on
other federal programs, higher taxes, or some combination of these steps.
Reluctance to resolve the Social Security and Medicare shortfalls is understandable, as doing so involves slowing the growth
of program benefits, increasing the age at which individuals become eligible for benefits, or increasing the taxes and premiums
that support these programs. Failure to enact such measures, however, will not shield participants collectively from adverse
effects. One way or the other the imbalance between scheduled benefits and future revenues must be resolved. Further delay
in enacting corrective legislation to do so as equitably as possible would simply mean that continued uncertainty will surround
how the imbalances will be resolved and that the unavoidable adjustments will be compressed into a shorter time period, be
concentrated upon fewer affected individuals, and be more disruptive as a result.
For many years, the Trustees Reports have contained illustrations of the magnitudes of changes to benefits or taxes required
to place Social Security and Medicare on financially sustainable paths. This year’s Message to the Public, for example,
explains that correcting these imbalances would require changes equal in the aggregate to 17 percent of Social Security tax
receipts or 14 percent of the program’s scheduled benefits; for Medicare Hospital Insurance, the comparable figures are 21
percent of tax receipts or 17 percent of scheduled benefits. Useful though these illustrations are, they understate the
likely effects of legislative actions over time. First, such illustrations assume that the full effect of legislation takes
place immediately, with no phase-in or lead time. Perhaps even more importantly, the benefit examples assume that legislators
would be equally willing to reduce support for current beneficiaries as to restrict the growth of benefits to future participants. In the past, policy makers have been reluctant to significantly reduce the benefits of those who have already begun to collect them. In a practical sense, therefore, changes adversely affecting younger generations are likely to be much more severe than indicated in these simple illustrations. The costs that will be borne by younger generations will grow significantly each year that a new cohort of baby boomers joins the benefit rolls.
We look forward to working with the other Trustees and the actuaries over the next few months to further refine the utility,
readability, and estimation methodology of these reports. In this effort, we will benefit from the input of two expert
Technical Review Panels, one for Social Security and the other for Medicare, whose members are evaluating the reports’
assumptions and methodologies. Probably the greatest challenge we will encounter will be to assure that the Trustees’
assumptions for the growth of Medicare and overall health care costs, notwithstanding their inherent uncertainty, are as
sound as possible.
Even in advance of these deliberations, we believe that the essential message conveyed by these reports is clear and will not
change, absent legislation: that the vital Social Security and Medicare programs face real and substantial challenges, and that
elected officials will best serve the interests of the public if financial corrections are enacted at the earliest practicable
time.
|
|
Charles P. Blahous III,
Trustee
| Robert D. Reischauer,
Trustee
|
|