1994-96 Advisory Council
Comparison Of Plans Joan T. Bok, Ann L. Combs, Edward M. Gramlich, Sylvester J. Schieber ;Marc M. Twinney, Fidel A. Vargas, and Carolyn L. Weaver
There are many ways in which different options for reforming Social Security might be compared. In this section we compare these plans and their implications for workers and beneficiaries. One initial caveat is in order. A crucial element of the Maintenance of Benefits (MB) plan has been the recommendation to invest up to 40 percent of the trust fund assets in private equity markets. But the final version of the MB plan recommends only that after a period of study and evaluation, there would be a possibility of investing in equities. There is no recommendation to fill the gap that is left in the financing package if equity investment is not pursued. None of the actuarial estimates have been modified to reflect this late change in the MB proposal. If equity investment is not pursued, either the payroll tax would have to be raised or benefits would have to be cut, significantly altering many of the comparisons between the plans.1/ The Council's Technical Panel on Trends and Issues in Retirement Savings recommended six criteria for evaluating reform proposals:
There is perhaps more to choose among the other two criteria i.e., the equity of lifetime taxes and benefits, and the promotion of overall national saving for retirement. In this statement we look at three important indicators of lifetime equityCreplacement rates, internal rates of return, and money's worth ratios across cohorts with different birth dates. Then we examine the impact of the alternative plans on national saving or national wealth. We start by looking at the impact of the plans on the Federal budget and entitlement spending for the next 35 years, and then consider the impact on overall national wealth. Each of these comparisons relies on the intermediate assumptions used in the 1995 Trustees' Report, as with the rest of the Council's report, and in line with the recommendations of the Council's Technical Panel on Assumptions and Methods. One exception to this rule involves the Consumer Price Index (CPI) assumption, where the Council requested that calculations be made using the latest BLS estimate that future inflation rates would be adjusted downward by 0.21 percent per year. Going beyond the Trustees' Report and the report of the Council's Technical Panel on Assumptions and Methods, the Council was also forced to project returns from equity holdings, both for the OASDI Trust Funds and in the IA and PSA defined contribution accounts. After getting outside advice on the matter, the Council assumed, in light of historical information, that the long-term rate of return on common stock would be 7 percent, exceeding that on Treasury bonds by 4.7 percent per year, that the IA and PSA accounts would be invested in stocks and bonds with the same asset mix as private 401(k) pension plans, and that fund administration costs would be one-half a basis point per year for the MB plan (100 basis points equals a percentage point), 10.5 basis points per year for the passively-managed IA plan, and 100 basis points per year for the PSA plan. 4/ It goes without saying that there are many uncertainties in these estimates. These uncertainties were highlighted by both of the Advisory Council's Technical Panels. They underlie the Council's recommendation that the SSA both make available data for private research and analysis, and engage in stochastic modeling. Moreover, Appendix II, written by Stephen C. Goss, who served as the Council's chief actuary, gives calculations under alternative assumptions, enabling one to get a sense of how the results might change under different future scenarios. Impact of the Proposals on Replacement Rates The first means of comparing plans, and a familiar method in past Social Security analyses, involves replacement rates. Replacement rates are defined here as the ratio of benefits payable at age 65 or the onset of disability to pretax earnings in the prior year. For these calculations, the Council has estimated replacement rates for workers with steady earnings at four different levels. The lowest-earning worker is assumed to have annual earnings of $11,000 in 1995 dollars; the next at $25,000 per year in 1995 dollars; the next at $40,000 per year; and the highest at $61,000 per year in 1995 dollars. These wage levels are roughly comparable to a minimum-wage worker, a worker with average covered earnings under Social Security, a worker who consistently earns about two-thirds the maximum taxable earnings level, and a worker who consistently earns the maximum taxable amount. For years prior to 1995, these 1995 wage levels are adjusted downward by the historical growth rate of average wages in the economy. Likewise, for years after 1995, each of these worker's wage levels are assumed to grow at the assumed rate of growth of average wages in the economy. The replacement rates are calculated for the various plans for workers born in 1930, 1935, and so forth on out to year 2005. Replacement rates are given for the four earnings classes in Figure R1 for full career workers retiring at age 65. For these workers, the MB plan holds replacement rates near the levels of those born in 1930 and retiring now. The reason for the slight decline in replacement rates is the increase in the age of eligibility for full retirement benefits already scheduled in present law. Under the IA plan, benefits from the central system are scaled back and the age of eligibility for full benefits is increased further. At the same time, workers will gain the proceeds of their individual accounts. The combination of these two changes leaves replacement rates for full career workers roughly at the levels in the MB plan and present law, assuming average rates of return on assets. For full career workers retiring at age 65 under the PSA plan, benefits from the central system are gradually replaced with the flat benefit equivalent to $410 per month in 1996. The flat benefit will be indexed by the rate of growth in wages for each cohort of workers until they reach eligibility age for benefits. Because wages generally grow more rapidly than prices, the purchasing power of the flat benefit should rise for each successive cohort of workers covered under the PSA plan. In addition to the flat benefit, workers will get the proceeds of their PSAs, and the combination leads to higher replacement rates than under present law and the two other options for all income classes of retired workers.5/
Figure R2 shows replacement rates for workers becoming disabled at age 50. Since in the two plans with defined contribution individual accounts, IA and PSA, 50-year-old disabled workers would not yet be eligible to receive the proceeds from their defined contribution accounts (they would have to wait until age 62), these replacement rate graphs assume no payments at all from the individual accounts. Under the MB plan, for workers becoming disabled at age 50 the benefits would be essentially equivalent to benefits under current law. The increase in the age of eligibility that would reduce benefits for full career workers is not relevant in the computation of disability benefits, and there is no decline at all in replacement rates. Under the IA plan, replacement rates fall below those in the MB plan for disabled workers because of changes in the benefit schedule. Under the PSA plan, replacement rates fall below those in the other two plans. This occurs as the age of eligibility for early retirement benefits is increased because a limit is placed on disability benefits to ensure that they do not exceed retirement benefits for the age-65 retiree. The reduction in future disability benefits is capped at 30 percent. Although the replacement rates for the disabled workers shown in the figure decline steadily under the PSA plan, for birth-years after 2036, they stabilize because by then the 30 percent reduction limit compared to current law would have been reached. As noted, the replacement rates in Figure R2 do not reflect lifetime benefit levels because they do not include proceeds from the individual accounts. Figure R3 shows retirement benefits payable at age 65 relative to earnings for the last full year of employment for a person disabled at age 50, including the proceeds of the individual accounts. The calculations in this instance assume that the normal retirement benefit would be paid at age 65. Final earnings used in the calculation are the earnings in the year prior to becoming disabled, indexed by increases in the CPI between the point of disability and attaining age 65. With final earnings being indexed by the CPI, replacement rates are shown relative to the standard of living achieved prior to the period of disability. Once again, the MB plan holds replacement rates essentially at the levels of current law. The commencement of distributions from the individual accounts under both the IA and PSA plans at retirement result in average retirement benefits that are somewhat higher than those provided by the MB plan.
*Present law replacement rates are virtually the same as those of the MB plan
*Present law replacement rates are virtually the same as those of the MB plan. For the IA and PSA plans, benefits include proceeds from the respective individual accounts. In this case, benefits at age 65 are compared to final earnings indexed by the CPI to age 65.
Internal Rates of Return under the Alternative Proposals While a good measure of actual benefits paid, replacement rates can be criticized because they do not consider contributions made. We now compare the various proposals in terms of levels of benefits provided in comparison to total contributions required to finance the options. One comparison measure is the internal rate of return (IRR). The IRR is the rate of return at which the present discounted value of future benefits is equal to the present discounted value of taxes paid. This is an important measure because it facilitates the comparison of the various proposals with current law, with each other, and with alternative investment options across generations of workers. Figure IRR1 shows the rates of return that single workers at different lifetime earnings levels are projected to receive from Social Security under current law. The redistributive characteristics of Social Security are reflected in the fact that the rates of return for the various prototypical workers are lower at higher levels of lifetime earnings. One of the concerns that most members of the Council had in considering various policy options was that for many of the workers in future cohorts of retirees these projected rates of return are quite low relative to the rates of return that these workers could achieve if they invested in financial assets widely available in the national economy. For example, the long-term rate of return on government bonds used throughout the calculations is 2.3 percent in excess of the future expected inflation rate. The expected rates of return on equities are between 4.5 and 5.0 percent higher than the expected rates of return on government bonds. In other words, all but the lowest-wage workers shown in Figure IRR1 could expect higher real rates of return, on average, by investing their payroll tax contributions in widely available financial instruments than they could expect from Social Security under current law. The concern about the relatively low rates of return implied by current law were heightened by the fact that the system is significantly underfunded. The relatively low rates of return could be exacerbated under policies that rebalance Social Security's financing by simply raising payroll taxes or cutting benefits, each of which would lower internal rates of return further. Concerns about low real rates of return for future retirees drove all Council members to seek policy recommendations that would gradually raise the rates of return on worker's payroll tax contributions. Figure IRR2 shows the real rates of return for single workers at the four prototypical earnings levels under the three policy options considered by the Council. For the cohorts of workers born before 1980, the lines representing the rates of return for the MB plan are essentially the same as current law. Under this option, the payroll tax for these workers would be the same as under current law throughout their working lives and benefits would be nearly equivalent to those defined in current law. For cohorts born after 1980, the increase in the payroll tax after 2045 would diminish their rates of return relative to current law. The reductions would be very small initially, and would grow relative to current law for each subsequent cohort of workers. But even for cohorts born in the year 2004, the last year for which calculations are shown, the rate of return on contributions for low-wage workers under the MB plan would drop only to 2.80 percent relative to 2.89 percent under current law. For maximum wage workers the comparable rates of return for those born in 2004 would be 0.46 under the MB proposal compared to 0.58 percent under current law. The projected rates of return under the IA plan would generally be reduced somewhat relative to the rates of return under current law or the MB proposal. The reduction in rates of return is the result of two opposing outcomes under the IA proposal. The reduction in Social Security benefits would result in reductions in the internal rate of return on the 12.4 percent of covered payroll that goes to finance OASDI benefits. The extra contributions of 1.6 percent of covered payroll that would go to finance the individual accounts under this option would have significantly higher rates of return than provided under current law. The higher rate of return on the individual account portion of total benefits, however, is not large enough to offset the lower rate of return on the 12.4 percent of covered payroll that would continue to finance OASDI benefits.
The PSA proposal is projected to result in somewhat higher rates of return than either of the other policy options considered by the Council. As in the case of the IA proposal, the calculation here includes the extra contributions required to finance this option, including the transition tax. Once again, the same two opposing forces would be present. The reduction in benefits provided directly through Social Security would significantly lower the rates of return on contributions financing those benefits for workers earning average wages and higher. This reduction in the rates of return on the benefits provided directly through Social Security would be even greater than in the case of the IA plan, but it would be on a smaller portion of the total payroll taxC7.4 percent rather than 12.4 percent. The expected rates of return on contributions to the PSAs for single workers would be significantly higher than the rates of return provided under current law. In this case, the higher rates of return on the PSAs would be large enough to more than offset the lower rate of return on the portion of the benefits still provided through Social Security. Figure IRR3 shows the internal rates of return for one-earner couples at various lifetime earnings levels. Here, the rates of return are considerably higher than in the case for single workers at any given level of earnings because of the spousal benefit. Indeed, the rates of return for maximum-wage workers in one-earner couples are higher than the rates of return for average-wage single workers. For low-wage workers in one-earner couples the rates of return on contributions under the PSA and MB plans are essentially the same and both are superior to the IA plan. In the other cases, the MB plan has higher projected rates of return and the other two plans are generally similar. To the extent that one of the spouses in a married couple has some taxable earnings but not enough to qualify for benefits on the basis of those earnings, the payroll taxes on those earnings would make the rates of return lower than shown in the figure. The reduction in the rates of return in such circumstances would be greater under the MB plan than under either of the alternatives, and least under the PSA plan. While one-earner couples were prevalent when the Social Security Act was passed in 1935, they are far less common today. The significant growth in the labor force participation rates of women over the last 25 years has meant that both spouses in most couples now work outside the home and pay OASDI taxes on their earnings. In these circumstances, the value of dependent spousal benefits is significantly less than for one-earner couples, lowering the rates of return on Social Security contributions accordingly. Figure IRR4 shows the projected rates of return on contributions for two-earner couples under the various policy options at various combinations of lifetime earnings. In general, these returns are somewhat lower than they are for one-earner couples and somewhat higher than they are for single individuals.
In developing the comparative analysis of rates of returns under the various policy options, an underlying assumption is that individual workers will invest their personal account funds like workers participating in 401(k) plans today with self-directed investment. A further assumption is that the workers will receive a rate of return consistent with the average historical long-term rates of return on equities. While these rates of return are commonly expected to persist into the future in developing analyses of this sort, there is no guarantee that the future returns will bear any resemblance to the past. To differing degrees, all of the options before the Council look worse if the historical rates of return do not hold up in the future. Proposals that rely more heavily on equities markets will have somewhat more exposure to the risk of declining capital values than those that use bonds. However, the prospect of significant declines in the value of capital assets does not mean that the benefits of a system financed principally through the taxation of labor, such as a pay-as-you-go social security retirement system, are free from the risks of a major decline in capital market values. If the nation were to experience a sustained drop in equity values, as occurred during the Great Depression, it is likely that there would be major disruptions to labor markets that would seriously undermine the financing base of a wage-based pay-as-you-go system as well. While there is no generally accepted way to deal with these risks, some indication of their importance is given in Figure IRR5. For each wage class worker, the figure shows the share of projected benefits based on their individual account. These shares are greater for high-wage workers than low-wage workers in both plans, indicating that low-wage workers are much less exposed to financial market risks. Although not shown, it is also true that even if the future stock market does not outperform bond markets, internal rates of return from the PSA plan will be on a par with those in the MB plan for workers in each wage class.
Another way to evaluate Social Security proposals is to determine the "money's worth" of payroll contributions. Money's worth ratios measure the present value of the benefits a typical individual has received or is expected to receive compared to the present value of the payroll taxes and other contributions that he or she has paid or is expected to pay, discounted at the actual past and projected future rates of return on government bonds held by the Social Security trust funds. Comparison of the estimated money's worth ratios for the plans before the Council suggests that each of the proposals would treat future generations much more equitably than is the case under current law and practice.
The calculations are done on a before-income-tax basis, with the transition payroll tax of the PSA plan included on the tax side. 6/ All benefit payments and tax payments for the different groups are converted to discounted present values at the real rate of interest on long-term U.S. government bonds, implicitly adjusting for the time value of money. For future benefits or payroll taxes, the calculations assume the real interest rate in the Trustees' report, 2.3 percent. But for the past, benefits and taxes are discounted by the historical real interest rate in the relevant year. Since the historical pattern showed high real interest rates in the 1980s and early 1990s, those who paid taxes then, and can expect benefits in the future, have particularly low values for their money's worth ratios. Appendix II shows the results when all tax and benefit payments are discounted by a constant 2.3 percent real interest rate. When these money's worth ratios equal 100 percent, the relevant worker is expected to receive, on average, the same rate of return investing in Social Security as he or she would have earned investing in long-term U.S. government bonds, or 2.3 percent in real terms over the long run. If the money's worth ratio is greater than 100 percent, the worker fares better under Social Security, including the amounts accumulated in individual accounts under the IA and PSA options; if it is less than 100 percent, the worker fares worse under Social Security and the reform options considered. But it should be remembered that Social Security does provide protection against inflation, against disability, and actuarially fair insurance for those with either very short or very long lifetimes. Hence these plans can still be very valuable for workers whose money's worth ratios are below 100 percent. In Figure M1, the money's worth ratios are given by year of birth for workers born from 1935 to 2005. Rather than show money's worth ratios for different classes of workers separately, all workers are assumed to have normal incidence of disability and mortality, with the treatment of disability and survivor's benefits in the plans factored into the computations. Because these plans treat single workers, married workers in one-earner couples, and married workers in two-earner couples differently, the calculations use a set of weights to compute the money's worth ratios for workers of different income classes and birth dates in rough proportion to the share of each cohort of workers' careers that they are expected to be in each of the family categories. In essence, these are weighted aggregate outcomes that roughly reflect the composition of each worker cohort by their marital status and the probabilities of becoming disabled or dying prior to retirement and leaving survivors. As a first standard of comparison, we show a line called PL PAYGO, present law pay-as-you-go. Payroll taxes would be increased to finance current-law benefits on a pay-as-you-go basis. Were this practice followed now, there would be no changes in OASDI benefits (beyond the adjustment for consumer prices), and the payroll tax would be left at the combined employer-employee rate of 12.4 percent for another 20 years and then it would rise as necessary to finance additional benefits for the baby boom cohort slated to retire at that time. Under this scenario, the money's worth ratios for average wage workers born in the 1950s would decline to about 75 percent, then rise a bit as the impact of the historically high real interest rates die out, and then decline again to about 75 percent for workers born in 2010. While not shown, money's worth ratios would be even lower for workers born after 2010. The system would be in long-term actuarial balance, but most younger workers and future generations would not be getting a very good money's worth return on their Social Security contributions. All members of the Council feel that this approach is not fair to these workers, and have opted for a significantly different approach.
Each of the three plans proposed by the Council was meant to achieve actuarial balance, and each was meant to give a much better return on the invested contributions of the nation's children and grandchildren. Again focusing on average wage workers, all three plans proposed by the Council stabilize money's worth ratios at or above 100 percent for young workers and future generations, hence being much fairer to these individuals than the pay-as-you-go approach commonly followed in the past. 7/ Among the plans, the PSA plan generates the highest money's worth ratios for each of the four income classes of workers born after the early 1960s. For workers born in the next century, this PSA money's worth ratio is above 100 percent for low and average earnings workers, for composite workers, and above 80 percent for the other income classes. These ratios are high because the PSA plan builds up funds quickly and allows a large share of the funds to be invested in the stock market. The MB plan does not significantly alter benefit or contribution levels in the early years and, hence, does not take as much advantage of the higher rates of return from the stock market. The lack of new funding results in money's worth ratios that are generally not as high as with the PSA plan. But it still has money's worth ratios of 100 percent or more for low and average earnings workers born in the next century, and close to 80 percent for the other classes of young workers. The IA plan does create new savings to take advantage of the higher rates of return associated with funded retirement programs, but since the defined contribution accounts are smaller than in the case of the PSA plan, it never permits as many funds to be invested in equities. But it too has money's worth ratios of 100 percent or more for low and average income workers born in the next century, and it still gives money's worth ratios close to 80 percent for the other classes of workers. While the IA plan is somewhat behind the PSA plan in terms of money's worth for cohorts born after 1960 and is nearly equivalent of the MB plan for most cohorts, of the three plans it relies least on a favorable performance of the stock market. As Appendix II shows, for example, in the extreme case where long-run returns on stocks do not exceed those on bonds, the IA money's worth ratios are very close to those of the PSA plan. 8/ It is also the only one of the three plans that does not worsen the finances of the HI Trust Fund in the short or long run.9/ Since workers with each of the earnings histories reflected in Figure M1 can have varied earnings patterns over their life span, or can marry someone with a different earnings history, money's worth ratios for workers who might be called grand compositesCwith average earnings and average family experience for their cohortsCare also shown. The grand composite money's worth ratios, shown in Figure M2, give the same patterns as those shown for the individual workers in Figure M1. For all classes of workers these ratios are gradually dropping now, both because of program changes and because of the historical movements in interest rates. Unless changes are made in Social Security, they will drop further. Federal Budgetary Considerations Another way in which the plans can be compared involves their impact on the Federal budget and the Federal government's future obligations. The Federal budget is essentially a cash flow budget, simply adding up cash revenues and subtracting cash expenditures for any given year. Technically, Social Security financing is done outside the budget although Social Security's revenues and outflows are invariably included in budget analyses when the level of total government operations or government's relative size and impact within the larger economy are evaluated. Each of the three proposals developed by the Council would change Social Security's financing over time and would affect the Federal budget accordingly. In addition to affecting cash flows, each of the proposals would also affect the government's future aggregate obligations and funding streams under Social Security.
Currently, Social Security is projected to reduce the deficit in the Federal budget by approximately 0.5 percent of GDP in 1998. If current law were to remain in place, this impact would gradually decline to 0.4 percent of GDP by 2008 and then to zero by 2014. In 2015, Social Security is expected to start running cash-flow deficits which would be increasingly negative thereafter. 10/ Each of the Council's three plans would change this situation. Figure F1 shows the net change in the direct effect on the U.S. Government's Unified Budget balances under the various options between 1998 and 2030. On a cash-flow basis, the PSA proposal would have a decidedly negative effect on the Federal budget over the first 30 years the plan is being implemented. This is because the net spending under the OASDI program would initially be the same as under current law, while projected revenues would be significantly reduced because workers would be contributing a share of their payroll taxes to their own PSAs. A portion of the cost of the transition to the PSA plan, from the unified budget perspective, would be covered by the proposed transition tax of 1.52 percent of covered payroll, but, during the early part of the transition from roughly 1998 to 2030Cthis added financing would be insufficient to meet the transition costs. The proposal calls for temporary transitional borrowing from the public to cover the gap. This annual borrowing would peak at around 2.0 percent of GDP in 2007 and then decline to zero over the next 22 years. Over the subsequent 10 to 15 years (i.e., by 2045), the added government borrowing from the public under this plan would be fully paid off. Under the PSA plan, Social Security begins to improve the government's cash-flow budget (relative to present law) in 2030.
Between the year 2000 and 2014, the MB plan would increase Federal borrowing from the public by 0.11 to 0.19 percent of GDP per year. The reason for this increased borrowing is that during the early years, the savings that are realized by increasing the averaging period and the extra revenues that are collected from the additional taxation of benefits do not generate sufficient revenues to finance the equity purchases under the proposal. After 2014, the assumed extra returns from the equity investment would have a positive net effect on the projected budget balances and the borrowing under this plan would be fully paid off by 2017. 11/ The IA plan is projected to have the most favorable impact of the three plans on the unified Federal budget balance. The net effect would be positive immediately and grow over time. The positive effect in this case is generated by the reductions in projected benefits and the increase in the taxation of benefits. The operations of the individual accounts financed by the mandated savings of 1.6 percent of covered payroll would be completely outside of the Federal budget. 12/ Because each of these proposals would affect the annual cash-flow budget, they also would affect the formal debt held by the public. Figure F2 shows the net cumulative change in Federal borrowing under each of the proposals. The IA proposal would reduce the outstanding Federal debt held by the public over the whole projection period. The MB plan initially would increase Federal borrowing in order to generate the funds to invest in the stock market. After 2017, the MB plan wold reduce the Federal debt. The PSA plan would create substantial new formal Federal debt with the issuance of the bonds used to finance the transition. 13/This added debt held by the public would be paid off by the year 2045 under the proposal. While the effects of the various proposals on the cash budget operations of the Federal government are important, they are only one of the fiscal implications of the proposals. As indicated earlier, the unified Federal budget uses cash flow accounting and largely ignores changes in the government's overall indebtedness. As a result, the government can take on substantial obligations that will have to be paid in future years without these obligations affecting the government's accounts during the year in which the obligations are generated. Table F1 shows, in present value terms, OASDI's projected benefit obligations over the 75-year projection period (1996-2070, using 1995 Trustees' Report assumptions modified to reflect lower increases in the CPI) under the various proposals before the Council. It also shows the present value of current reserves plus the present value of projected income that would be available to pay for the benefits under the various plans. Under present law, the long-range deficit is $2.5 trillion in present value terms. In other words, if the trust funds today held an extra $2.5 trillion in an interest bearing account, the projected tax collections and interest income over the next 75 years would be sufficient to cover projected benefits over that period. The PSA and IA plans would completely eliminate Social Security's long-range deficit, although each would do so in different ways. The MB plan would eliminate the long-range deficit, assuming 40 percent of the trust fund assets were invested in private equities.
The PSA plan would reduce the projected benefit obligations under current law significantly, by 31.5 percent. It also would reduce the resources available to pay for these obligations because workers would invest 5 percent of their covered pay in their own accounts rather than sending the funds to the Federal government, although this revenue loss would be partly offset by the 1.52 percent transition payroll tax. In net terms, the PSA proposal would turn the $2.5 trillion deficit into a positive balance of $114 billion over the 75-year projection period, ignoring the accumulations in the PSA accounts. The IA plan would reduce projected obligations less than the PSA plan but it would maintain the full flow of funds from the payroll tax under current law and increase the revenues accruing to the program through increased taxation of benefits and coverage of newly hired state and local workers. The estimated net effect of the IA plan would be to eliminate the long-term deficit of the system and create a positive balance of $751 billion, ignoring the accumulations in the IA accounts. The MB plan would reduce projected benefit obligations under current law slightly, by 0.8 percent. The rebalancing of the system under this option requires new sources of revenue. The MB plan would generate an estimated $1 trillion surplus over the 75-year projection period. The largest single rebalancing item in this proposal is the investment of trust fund assets in private equities. If this were not done, the MB plan would still leave net unfunded obligations of $406 billion in present value terms.
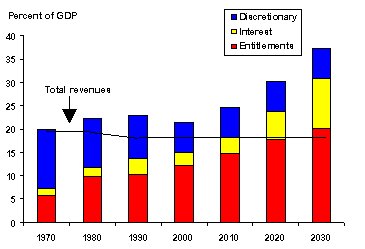
* Balances do not include the individual account balances in either the PSA or the IA proposals. NOTE: Evaluated as of January 1, 1996 for the period 1996 to 2070, using 1995 Trustees 	Report assumptions, modified to reflect lower increases in the CPI. Entitlement Spending Considerations One of the primary goals of each of the three proposals being advocated by members of the Advisory Council is to bring the OASDI programs back into actuarial balance in a fashion that stabilizes Trust Fund balances at the end of the projection period. All Council members believe this is absolutely necessary for restoring the public's faith in the system. In addition, a number of Council members feel that the spending level at which the system is balanced should be at or below the level implied by current law. This conviction parallels work that was done by the Bipartisan Commission on Entitlement and Tax Reform that finished their deliberations during our own discussions, and that reported to us. During 1994, the Bipartisan Commission on Entitlement and Tax Reform considered Social Security commitments as part of the Federal government's larger total entitlement commitments. Entitlement spending by the Federal government includes spending that is generally referred to as mandatory spending, not including interest, but including offsetting receipts and premiums for deposit insurance. In general, a program is considered an entitlement program if a court would find that public law legally obligates the government to make payments to persons meeting the program's eligibility criteria. Entitlement programs include Social Security, Medicare, Federal retirement programs, Medicaid, food stamps, family support assistance, supplemental security income, child nutrition programs, and earned income tax credits. In fiscal 1994, Federal outlays under the entitlement umbrella totaled $712 billion, of which 44 percent was attributable to Social Security, and another 31 percent to Medicare and Medicaid, spending which largely benefits the same people. 14/ The Entitlement Commission's assessment of future spending on Federal entitlement programs relative to future Federal revenues is summarized in Figure E1. The Commission found that total Federal revenues have held relatively constant at roughly 19 percent of GDP over the last 25 years. In 1970, about one-quarter of total Federal revenues was required to finance entitlement programs. By 1990, the share of Federal spending on entitlement programs had grown to about 10 percent of GDP, or slightly more than half of current Federal revenue. The Commission projected that entitlement spending under current law would equal 20 percent of GDP by 2030, more than the share of GDP taxpayers have allocated to the entire Federal government over the last quarter century. When the burden of interest payments is added on, entitlement and interest spending combined account for much more than projected federal taxes in 2030, seemingly an unsustainable situation.
The Entitlement Commission's projections suggest that, unless Federal taxes are increased, the nation must significantly constrain entitlement spending. This suggestion is relevant to our deliberations because Social Security comprises such a large share of all entitlement spending. While Social Security is not the most rapidly growing component of spending, it is projected to grow significantly as a percentage of GDP in coming years and it could be one of the more sensible programs to limit. Figure E2 shows projected OASDI spending as a percent of GDP over the 75-year projection period under various policy options. Under current law, OASDI spending levels would rise from around 4.7 percent of GDP now to about 6.7 percent of GDP by 2030, about 20 percent of the projected increase in entitlement spending over the period. Benefit levels under the MB plan would be virtually identical to current law benefit levels over the projection period, not changing Entitlement Commission projections at all. The IA proposal eventually would constrain the growth in OASDI spending somewhat, although spending would rise during the period when the baby boom generation passes into retirement. Spending is projected to peak at 5.7 percent of GDP around 2030 and then decline and stabilize at 5.2 percent of GDP. Under the PSA proposal, the benefits paid through the OASDI trust funds would decline slightly until the bulk of the baby boomers reached retirement age, remain relatively flat during their retirement, and then gradually decline toward 3 percent of GDP.
National Wealth Considerations In addition to its effects on government budgets and obligations, these proposals would also have differential effects on the overall wealth of the nation. One measure of the change in national wealth due to these proposals would be the increase in private assets under the various plans, both those held in the individual accounts and the accumulated equity holdings in the trust funds, net of any changes in the Federal Government's borrowing. While broader than the Federal budget alone, this measure might still be considered a narrow measure of the effects on national wealth because it does not consider the effects of other unfunded government obligations that are not reflected in the government's formal debt or any secondary effects the proposals may have on workers' other savings or on the government's fiscal policies. But even though this measure of national wealth has its limitations, it still provides an indication of whether the nation will be more or less able to afford the benefits contemplated under the different proposals over the long run. The first order effects of the plans on national wealth are shown in Figure W1. For the MB plan, where equity purchases are still considered Federal outlays, the accumulated equity investment is considered a national asset. For the other two plans, the accumulated value of the non-budget individual accounts is included as a national asset. Each plan is also debited an appropriate amount to the extent it is diverting revenues now credited to the HI Trust Fund. The added government borrowing under the PSA proposal is also debited as is appropriate. The figure shows what can be called the first order wealth effects. They are considered first order effects for three reasons. First, because of the large accumulations in individual accounts contemplated under the PSA and IA plan, there could be offsetting private reactions. Specifically, some workers might reduce their other retirement savings because they perceive an increase in their wealth in the revised Social Security system. Second, the higher saving in these plans would itself contribute to a higher GDP and permit higher benefits to be paid in the next century. Third, the additional Federal borrowing in the MB and PSA plans and the accumulation of very large holdings of special-issue government bonds in the Social Security trust funds under the MB and IA plans might induce offsetting government actions. Specifically, the former may induce more fiscal responsibility in the rest of the budget; the latter might induce less. At this point, it is difficult to estimate the importance of such reactions and the Council has not tried to do so.
From this first order perspective, the MB plan gradually increases national wealth over the whole projection period. Because much of the early purchase of equities is financed by added government borrowing, the first order wealth effect is not as great as under the other two plans. The IA plan raises national wealth by cutting Federal borrowing, and also directly due to the Individual Accounts. The PSA plan initially adds to the Federal government's formal debt, but raises national wealth from the outset because the PSA accounts are consistently larger than the increases in formal Federal debt under the plan. By 2030, the PSA plan is generating the most national wealth, with the IA plan in second place and the MB plan trailing behind.
An overall evaluation of these plans depends on the criteria used. No one of the plans surpasses the others in all dimensions. We have shown that the PSA plan looks best in terms of projected replacement rates for full career workers, though it lags behind the other plans in terms of replacement rates for disabled workers. The PSA plan generally does best in terms of money's worth ratios for younger workers and future generations, though the MB plan does better in terms of money's worth ratios for older workers over the next four decades. The IA plan does best in terms of reducing Federal debt. The PSA plan does best in reducing entitlement spending and in raising the national wealth.
2/ Since ultimately the PSA plan provides a flat benefit for full-career workers, the retirement income adequacy provided through the central defined benefit plan is not as large as in the other plans, although the PSA accounts are expected to more than make up for the difference. 3/ Since a large share of the PSA plan’s contributions are to individual accounts, it will have smaller distortionary effects on workers’ behavior than the other plans. 4/ The underlying basis for the rate of return assumptions can be found in the paper prepared by Dr. Joel Dickson for the Council included in Volume II of this report, page 484. The asset mix assumptions are described in Appendix II. 5/ Since the PSA accumulations can only be converted to annuities privately, there could be some reduction in the actual benefits provided under this proposal because of the expense of purchasing a private annuity. But it should also be recognized that if workers retain their PSA balances past their expected retirement age, the accumulation may exceed that in an annuitized account. The first factor means that the replacement rates may be below those shown in the figure; the second above. Economists generally believe that workers covered by defined contribution type plans tend to work longer and save somewhat more than workers covered by defined benefit type plans that require annuitization. 6/ This means before accounting for the payment of income taxes on benefits. It could be argued that for some purposes it would be appropriate to do the calculations after taxes have been paid. Though the differences between the two approaches are modest, the after-tax numbers would generally lower the MB plan’s money’s worth ratios the most and the PSA plan’s ratios the least. These after-tax numbers are shown in Appendix II. 7/ Without equity investment, the MB proposal would reduce the MB's money's worth ratios towards those of the PL PAYGO plan. 8/ It is impossible to say how the IA or PSA money’s worth ratios would compare to those of the MB plan if the long-run return on stocks does not exceed that on bonds because in that event the MB plan would require some unspecified combination of higher taxes or lower benefits. Either change would lower the MB plan’s money’s worth ratios. Another, perhaps significant, uncertainty applies to investment risk. Under the less-regulated PSA plan, there could be more investment risk than in the index funds of either the MB or IA plans. If so, the PSA money’s worth ratios could either be higher or lower than shown. 9/ This adjustment is relevant because HI taxes would have to be raised more in the MB and PSA plans. The supplemental statement of Marc M. Twinney gives the exact adjustments for this consideration. 10/ Recall that this report is based on the intermediate assumptions in the 1995 OASDI Trustees Report, with a modified inflation assumption. This changes the projection somewhat relative to those contained in either the 1995 or 1996 Trustees Reports. 11/ Some economists believe that the increased supply of bonds from both the PSA and the MB plans would increase Federal interest rates. If so, there would be added federal interest payments that would have to be borne by taxpayers. While the PSA plan would increase Federal borrowing, it also would increase national saving from the outset which might ameliorate any interest rate effects of the increased Federal borrowing. 12/ If the Individual accounts in the IA plan are financed out of taxable income but do not generate new savings, there could be some added long-run budget cost because interest accruing to the funds in the accounts would not be taxable. A similar problem exists with the PSA plan. 13/ The net effect of this financing mechanism would be to convert a portion of the implicit debt implied by Social Security into explicit government debt. 14/ Historical Tables, Budget of the United States Government, Fiscal Year 1996 (Washington, D.C., Executive Office of the President, Office of Management and Budget), p. 103. 15/ In these projections, Medicare and Social Security outlays follow the 1994 Medicare and Social Security Trustees' "best estimates." Medicaid outlays are assumed to reflect demographic changes and the increases in health care costs that underlie the Medicare projections. All other spending and revenues are assumed to follow 1994 Congressional Budget Office projections through 1999 and to grow in proportion to the overall economy thereafter. |
|||||||||||||||||||||||||||||||||||||||||||||||||||||||||||||||||||||||||||||||