Status of the Social Security and Medicare Programs
A SUMMARY OF THE 2020 ANNUAL REPORTS
Social Security and Medicare Boards of TrusteesEach year the Trustees of the Social Security and Medicare trust funds report on the current and projected financial status of the two programs. The reports include extensive information about these important social insurance programs and careful analysis of their outlook. We believe they fully and fairly present the current and projected financial condition of their respective programs, subject to the following caveat.
The projections and analysis in these reports do not reflect the potential effects of the COVID-19 pandemic on the Social Security and Medicare programs. Given the uncertainty associated with these impacts, the Trustees believe that it is not possible to adjust their estimates accurately at this time.
Social Security and Medicare both face long-term financing shortfalls under currently scheduled benefits and financing. Both programs will experience cost growth substantially in excess GDP growth during through the mid-2030s due to rapid population aging. Medicare also sees its share of GDP grow through the late 2070s due to increases in the volume and intensity of services provided. Based on our best estimates, the reports show:
• The Old-Age and Survivors Insurance (OASI) Trust Fund, which pays retirement and survivors benefits, will be able to pay scheduled benefits on a timely basis until 2034, the same as reported last year. At that time, the fund’s reserves will become depleted and continuing tax income will be sufficient to pay 76 percent of scheduled benefits.
• The Disability Insurance (DI) Trust Fund, which pays disability benefits, will be able to pay scheduled benefits until 2065, 13 years later than in last year’s report. At that time, the fund’s reserves will become depleted and continuing tax income will be sufficient to pay 92 percent of scheduled benefits.
• The OASI and DI funds are separate entities under law. The report also presents information that combines the reserves of these two funds in order to illustrate the actuarial status of the Social Security program as a whole. The hypothetical combined OASDI funds would be able to pay scheduled benefits on a timely basis until 2035, the same as reported last year. At that time, the combined funds’ reserves will become depleted and continuing tax income will be sufficient to pay 79 percent of scheduled benefits.
• The Hospital Insurance (HI) Trust Fund, which pays Medicare Part A inpatient hospital expenses, will be able to pay scheduled benefits until 2026, the same as reported last year. At that time, the fund’s reserves will become depleted and continuing total pro-gram income will be sufficient to pay 90 percent of total scheduled benefits.
• The Supplemental Medical Insurance (SMI) Trust Fund has two accounts: Part B, which pays for physician and outpatient services, and Part D, which covers prescription drug benefits. SMI is adequately financed into the indefinite future because current law provides financing from general revenues and beneficiary premiums each year to meet the next year’s expected costs. Due to these funding provisions, the rapid growth of SMI costs will place steadily increasing demands on both taxpayers and beneficiaries.
• The Trustees are issuing a determination of projected excess general revenue Medicare funding for the fourth consecutive year. This determination is given when the difference between Medicare’s total outlays and its dedicated funding sources is projected to exceed 45 percent of outlays within 7 years. This year’s determination triggers an issuance of a Medicare funding warning for the third consecutive year.
One can view the financial operations of Medicare and Social Security in the context of the programs’ trust funds or in the context of the overall Federal government’s unified budget. In the latter context, Social Security and Medicare together accounted for 41 percent of total federal expenditures in fiscal year 2019. The unified budget includes current trust fund operations. Consequently, any drawdown of trust fund balances, as well as general fund transfers into Medicare’s SMI fund, increases financial pressure on the unified budget.
Key Changes Since Last Year
The 75-year (2020-2094) actuarial deficit of the combined OASI and DI trust funds increased from 2.78 to 3.21 percent of taxable payroll since the 2019 reports. As shown in Table 1, this result was due to the combined effects of changes in methodology, legislation, regulation, economic, demographic, and programmatic assumptions, and recent observed experience. The following changes had the largest effects.
• The excise tax on high-cost, employer-sponsored group health plans (commonly referred to as the Cadillac tax) was repealed.
• The following long-range ultimate assumptions were changed:
• The total fertility rate was reduced from 2.0 to 1.95 births per woman.
• Consumer price inflation was reduced from 2.6 to 2.4 percent.
• The real interest rate was reduced from 2.5 to 2.3 percent.
• The disability incidence rate was reduced from 5.2 to 5.0 per 1000 covered workers.
• The 75-year valuation period was changed from 2019-2093 to 2020-2094.
| Item | OASI | DI | OASDI |
|---|---|---|---|
| Actuarial balance shown in the 2019 Report | -2.67 | -.12 | -2.78 |
| Changes in actuarial balance due to changes in: | Legislation / Regulation | -.12 | .00 | -.12 |
| Valuation period | -.05 | -.01 | -.05 |
| Demographic data and assumptions | -.12 | .00 | -.13 |
| Economic data and assumptions | -.16 | -.02 | -.18 |
| Disability data and assumptions | -.01 | .06 | .05 |
| Methods and programmatic data | -.02 | .02 | .00 |
| Total change in actuarial balance | -.47 | .05 | -.43 |
| Actuarial balance shown in the 2020 Report | -3.14 | -.07 | -3.21 |
Note: Totals do not necessarily equal the sum of rounded components.
The 75-year (2020-2094) actuarial deficit of the HI Trust Fund decreased from 0.91 to 0.76 percent of taxable payroll. As shown in Table 2, this result was due to the combined effects of changes in methodology, legislation, and economic, demographic, and programmatic assumptions, including the changes discussed above for OASDI. The principal changes exclusively affecting Medicare are:
• Lower projected spending due to a methodological change in the projection of health care spending that considers time until death.
• Higher projected enrollment and spending per beneficiary in Medicare Advantage.
• Higher projected spending outside the prospective payment system for acute care hospitals.
| HI | |
|---|---|
| Actuarial balance shown in the 2019 Report | -0.91 |
| Changes in actuarial balance due to changes in: | Valuation period | -.01 |
| Base estimate | .07 |
| Private health plan assumptions | -.12 |
| Hospital assumptions | -.06 |
| Other provider assumptions | .00 |
| Methodological changes | .42 |
| Legislation changes | -.10 |
| Other economic and demographic assumptions | -.05 |
| Total change in actuarial balance | .15 |
| Actuarial balance shown in the 2020 Report | -.76 |
Conclusion
Lawmakers have many policy options that would reduce or eliminate the long-term financing shortfalls in Social Security and Medicare. Lawmakers should address these financial challenges as soon as possible. Taking action sooner rather than later will permit consideration of a broader range of solutions and provide more time to phase in changes so that the public has adequate time to prepare.
By the Trustees:Secretary of the Treasury,
and Managing Trustee of the Trust Funds.
Alex M. Azar II,
Secretary of Health and Human Services,
and Trustee.
Secretary of Labor,
and Trustee.
Andrew Saul,
Commissioner of Social Security,
and Trustee.
In 2019, Social Security’s reserves were $2.9 trillion at the year’s end, having increased by $2 billion. The Trustees project that under the intermediate assumptions, the Old-Age and Survivors Insurance (OASI) Trust Fund will be able to pay full benefits on a timely basis until 2034, unchanged from last year. The Disability Insurance (DI) Trust Fund is now projected to be able to pay full benefits until 2065, 13 years later than indicated in last year’s Social Security report. Disabled-worker applications have declined substantially since 2010 and the number of disabled-worker beneficiaries in current payment status has been falling since 2014. Accordingly, the Trustees have again reduced the long-range disability incidence rate assumption in this report.
The projected reserve depletion date for the combined OASI and DI funds is 2035, the same as in last year’s report.1 Over the 75-year projection period, Social Security faces an actuarial deficit of 3.21 percent of taxable payroll, increased from the 2.78 percent figure projected last year. The main causes are (1) the repeal of the excise tax on employer-sponsored group health insurance premiums above a specified level (commonly referred to as the “Cadillac tax”), which slows the projected growth in real covered earnings and results in less payroll tax income, and (2) changes in assumptions including lower anticipated fertility rates, consumer inflation, and interest rates. The actuarial deficit equals 1.1 percent of gross domestic product (GDP) through 2094.
Reserves in Medicare’s Hospital Insurance (HI) Trust Fund decreased by $6 billion to a total of $195 billion at the end of 2019. The Trustees project that the HI Trust Fund will be able to pay full benefits until 2026, unchanged from last year’s Medicare report. HI income is projected to be lower than last year’s estimates due to lower payroll tax revenue associated with the repeal of the health insurance excise tax. HI expenditures are expected to be lower than last year’s estimates because of lower-than-projected 2019 spending, lower projected provider payment updates, and the incorporation of time-to-death into the demographic factors used in the projection model. Beneficiaries closer to death tend to have higher health spending, regardless of age, and the demographic factors now explicitly take that pattern into account. For the 75-year projection period, the HI actuarial deficit has decreased to 0.76 percent of payroll from 0.91 percent in last year’s report, and is equivalent to 0.3 percent of GDP through 2094.
The Supplementary Medical Insurance (SMI) Trust Fund held $109 billion in assets at the end of 2019. Parts B and D are expected to be adequately financed over the next 10 years and beyond because income from premiums and general revenue are reset each year to cover expected costs and ensure an adequate reserve for Part B contingencies.
The projections and analysis in this year’s reports do not reflect the potential effects of the COVID-19 pandemic on the Social Security and Medicare programs. Given the uncertainty associated with these impacts, the Trustees believe that it is not possible to adjust their estimates accurately at this time.
What Are the Trust Funds? Congress established trust funds managed by the Secretary of the Treasury to account for Social Security and Medicare income and disbursements. The Treasury credits Social Security and Medicare taxes, premiums, and other income to the funds. There are four separate trust funds. For Social Security, the OASI Trust Fund pays retirement and survivors benefits and the DI Trust Fund pays disability benefits. For Medicare, the HI Trust Fund pays for Part A inpatient hospital and related care. The SMI Trust Fund comprises two separate accounts: Part B, which pays for physician and outpatient services, and Part D, which covers prescription drug benefits.
The only disbursements permitted from the funds are benefit payments and administrative expenses. Federal law requires that all excess funds be invested in interest-bearing securities backed by the full faith and credit of the United States. The Department of the Treasury currently invests all program revenues in special non-marketable securities of the U.S. Government which earn interest equal to rates on marketable securities with durations defined in law. The balances in the trust funds, which represent the accumulated value, including interest, of all prior program annual surpluses and deficits, provide automatic authority to pay benefits.
What Were the Trust Fund Operations in 2019 In 2019, 54.1 million people received OASI benefits, 9.9 million received DI benefits, and 61.2 million were covered under Medicare. A summary of the trust fund operations is shown below (Table 1). The OASI and SMI Trust Fund reserves increased in 2019; DI and HI Trust Fund reserves declined.
| OASI | DI | HI | SMI | |
|---|---|---|---|---|
| Reserves (end of 2018) | $2,797.9 | $97.1 | $200.4 | $104.3 |
| Income during 2019 | 917.9 | 143.9 | 322.5 | 472.3 |
| Cost during 2019 | 911.4 | 147.9 | 328.3 | 467.9 |
| Net change in Reserves | 6.5 | -4.0 | -5.8 | 4.4 |
| Reserves (end of 2019) | 2,804.3 | 93.1 | 194.6 | 108.8 |
Note: Totals do not necessarily equal the sum of rounded components.
Table 2 shows payments, by category, from each trust fund in 2019.
| Category (in billions) | OASI | DI | HI | SMI |
|---|---|---|---|---|
| Benefit payments | $902.8 | $145.1 | $322.8 | $462.8 |
| Railroad Retirement financial interchange | 4.9 | 0.1 | — | — |
| Administrative expenses | 3.7 | 2.7 | 5.5 | 5.1 |
| Total | 911.4 | 147.9 | 328.3 | 467.9 |
Note: Totals do not necessarily equal the sum of rounded components.
Trust fund income, by source, in 2019 is shown in Table 3.
| Source (in billions) | OASI | DI | HI | SMI |
|---|---|---|---|---|
| Payroll taxes | $805.1 | $139.4 | $285.1 | — |
| Taxes on OASDI benefits | 34.9 | 1.6 | 23.8 | — |
| Interest earnings | 77.9 | 2.9 | 6.5 | $2.6 |
| General Fund reimbursements | a | a | 1.3 | -8.1 |
| General revenues | — | — | — | $346.5 |
| Beneficiary premiums | — | — | 3.9 | 115.2 |
| Transfers from States | — | — | — | 12.3 |
| Other | a | — | 1.8 | 3.8 |
| Total | 917.9 | 143.9 | 322.5 | 472.3 |
Note: Totals do not necessarily equal the sum of rounded components.
a Less than $50 million.
In 2019, 54.1 million people received OASI benefits, 9.9 million received DI benefits, and 61.2 million were covered under Medicare. A summary of the trust fund operations is shown below (Table 1). The OASI and SMI Trust Fund reserves increased in 2019; DI and HI Trust Fund reserves declined.
In 2019, the HI Trust Fund’s total income ($322 billion), including $7 billion of interest income (Table 3), fell short of program expenditures ($328 billion). The Trustees project deficits in all years, with reserves depleting in 2026. For SMI, general revenues, which are set prospectively based on projected costs, are the largest source of income.
What Is the Outlook for Future Social Security and Medicare Costs in Relation to GDP? One instructive way to view the projected costs of Social Security and Medicare is to compare the costs of scheduled benefits and administrative expenses for the programs with GDP, the most frequently used measure of the total output of the U.S. economy (Chart A).
Under the intermediate assumptions employed in the reports, the costs of these programs as a percentage of GDP increase substantially through about 2035 because: (1) the number of beneficiaries rises rapidly as the baby-boom generation retires; and (2) the lower birth rates that have persisted since the baby boom cause slower growth of employment and GDP.
Social Security’s annual cost as a percentage of GDP is projected to increase from 5.0 percent in 2020 to about 5.9 percent by 2038, then decline to 5.8 percent by 2053 before generally rising to 5.9 percent of GDP by 2094. Under the intermediate assumptions, Medicare cost rises from 3.9 percent of GDP in 2020 to 6.0 percent of GDP by 2044 due mainly to the rapid growth in the number of beneficiaries, and then increases further to 6.5 percent by 2094. The growth in health care cost per beneficiary becomes the larger factor later in the valuation period, particularly in Part D.
Chart A—Social Security and Medicare Cost as a Percentage of GDP
In 2020, the combined cost of the Social Security and Medicare programs is estimated to equal 8.8 percent of GDP. The Trustees project an increase to 11.6 percent of GDP by 2035 and to 12.3 percent by 2094, with most of the increase attributable to Medicare. Medicare’s annual relative cost is expected to rise gradually from 77 percent of the cost of Social Security in 2020 to become the more costly program by 2040. During the last 25 years of the long-range period, Medicare is, on average, about 9 percent more costly than Social Security.
The projected costs for OASDI and HI depicted in Chart A and elsewhere in this summary reflect the full cost of scheduled current-law benefits without regard to whether the trust funds will have sufficient resources to meet these obligations. Current law precludes payment of any benefits beyond the amount that can be financed by each of the trust funds, that is, from annual income and trust fund reserves. In years after trust fund reserve depletion, the amount of benefits that would be payable is lower than shown because OASI, DI, and HI, by law, cannot borrow money or pay benefits that exceed the asset reserves in their trust funds. The projected Medicare costs assume realization of the full estimated savings specified by current law. As described in the Medicare Trustees Report, the projections for HI and SMI Part B depend significantly on the sustained effectiveness of various current-law cost-saving measures, in particular, the lower increases in Medicare payment rates to most categories of health care providers.
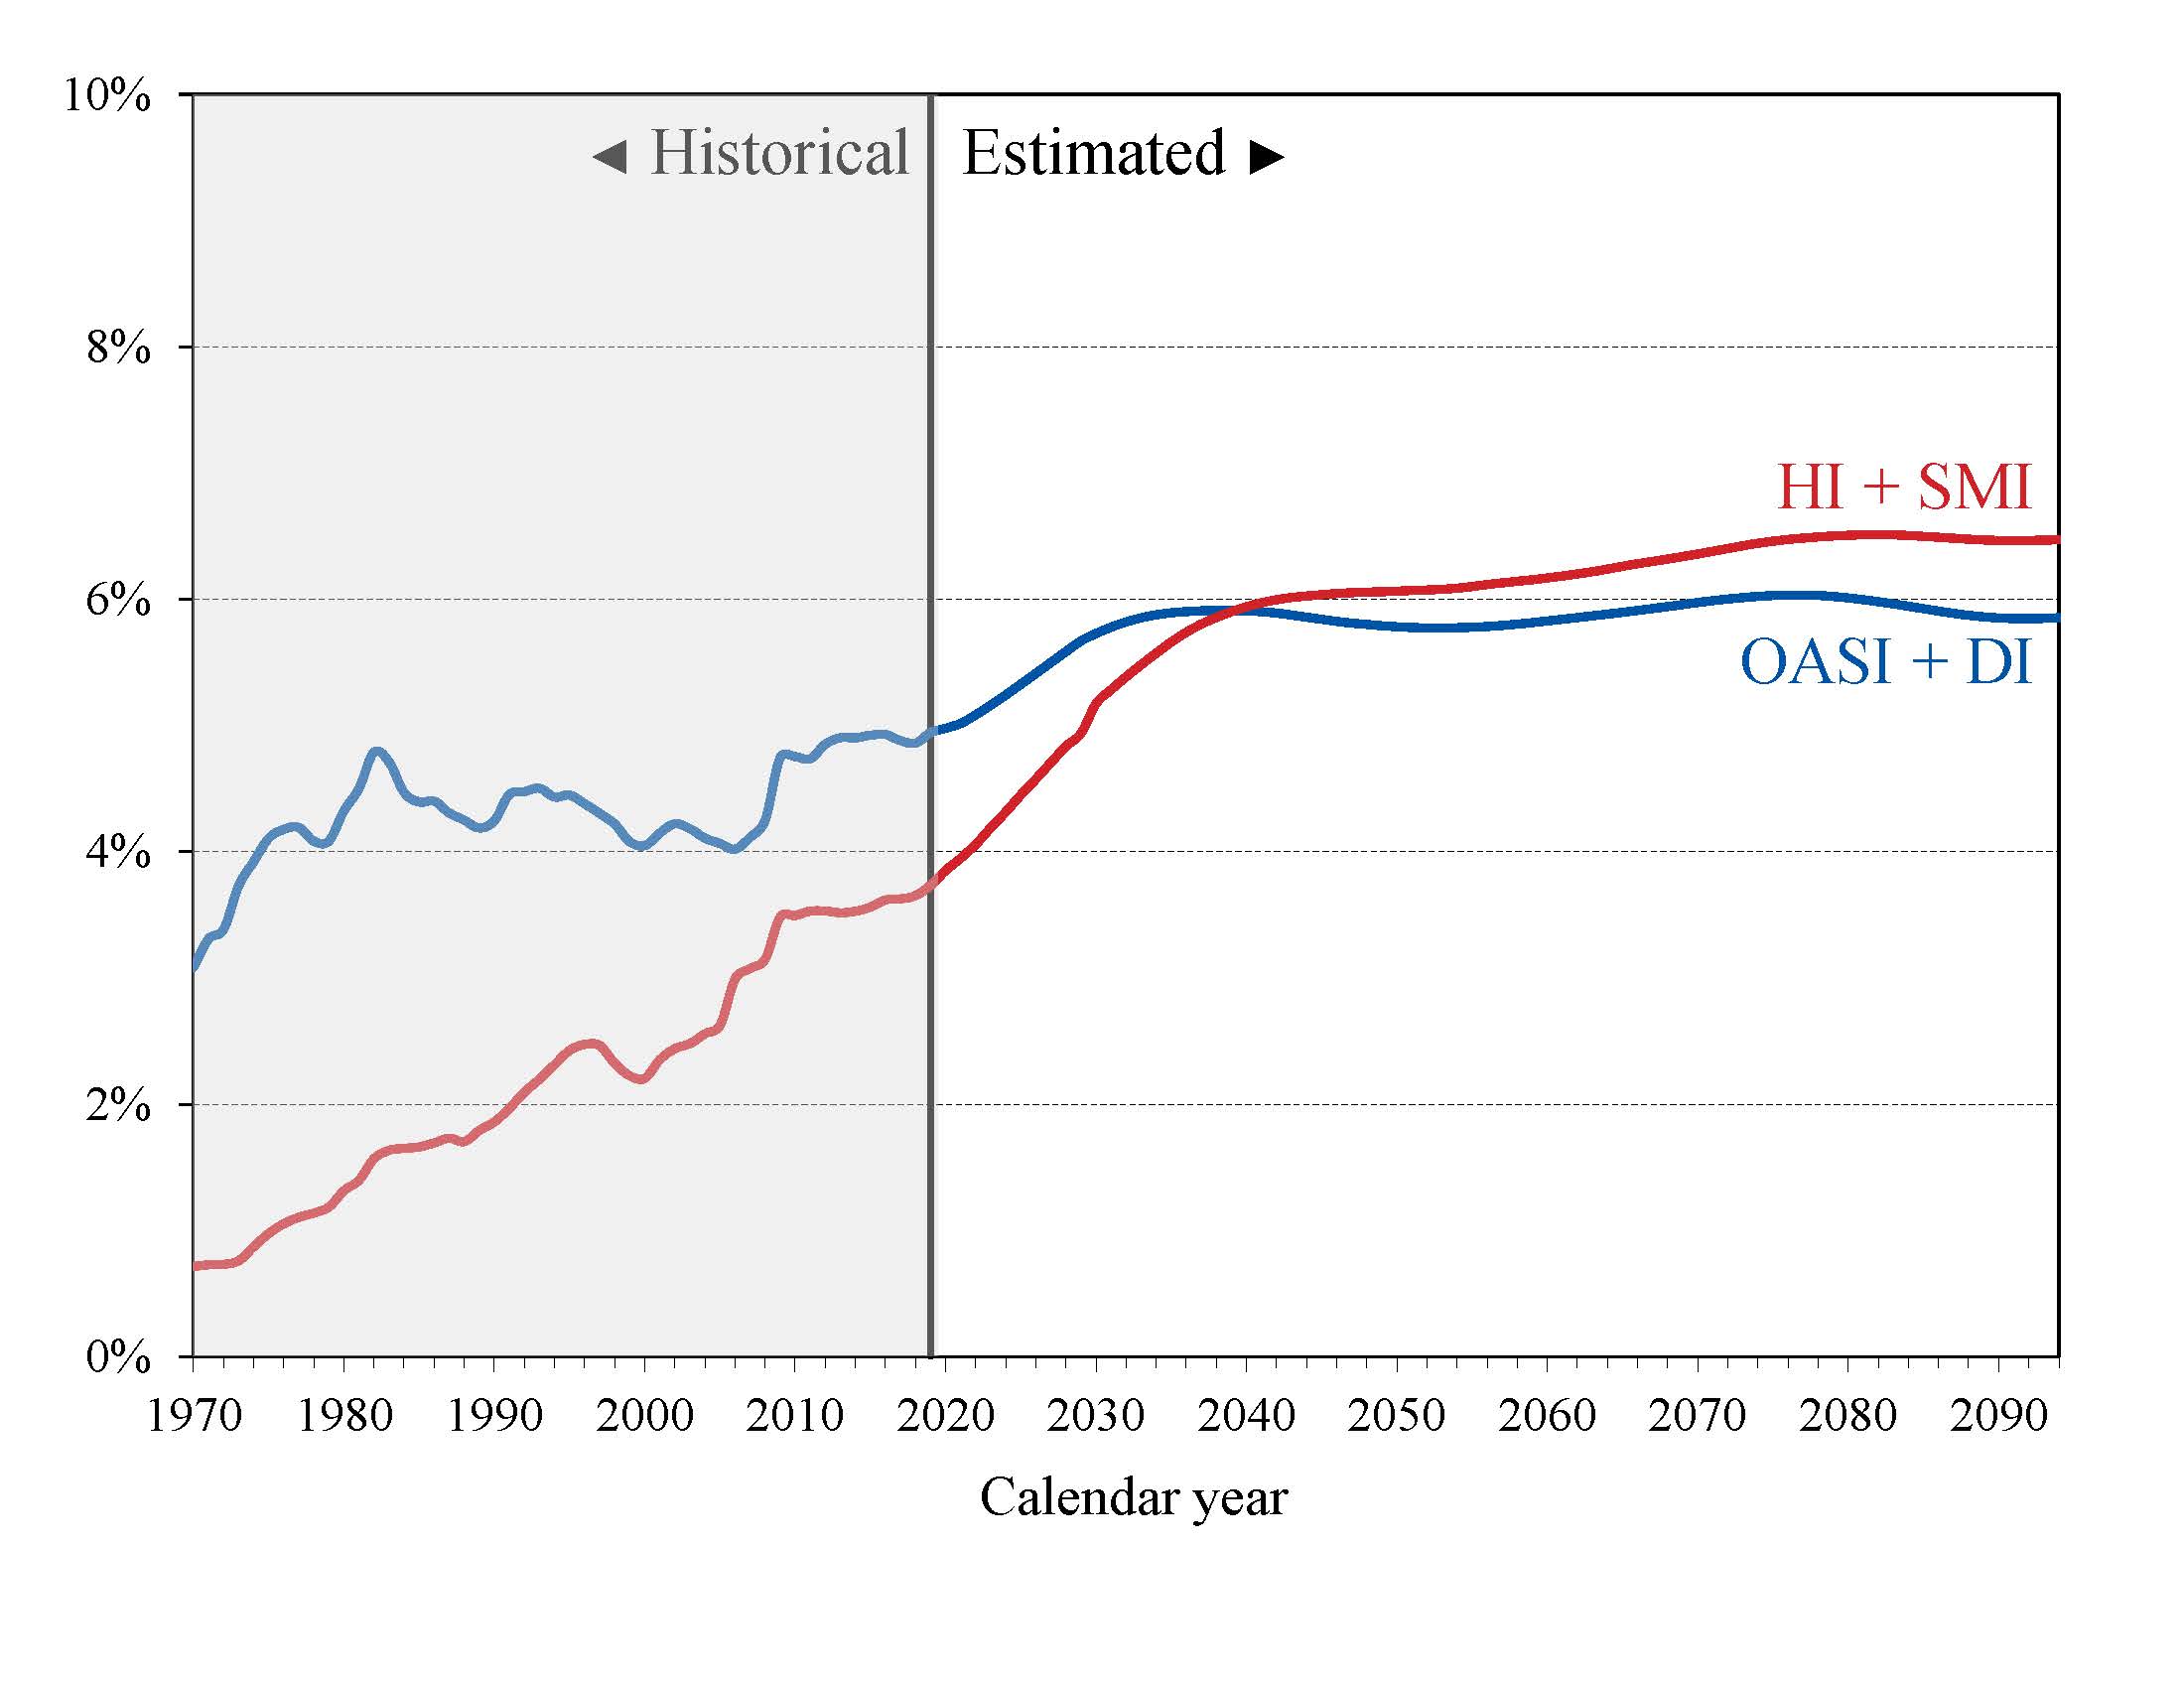
What is the Outlook for Future Social Security and Medicare HI Costs and Income in Relation to Taxable Earnings? Because the primary source of income for OASDI and HI is the payroll tax, it is informative to express the programs’ incomes and costs as percentages of taxable payroll—that is, of the base of worker earnings taxed to support each program (Chart B).
Chart B—OASDI and HI Income and Cost as Percentages
of Their Respective Taxable Payrolls
It is important to understand that the two programs have different taxable payrolls. HI taxable payroll is about 26 percent larger than that of OASDI because the HI payroll tax is imposed on all covered earnings while OASDI taxes apply only to earnings up to a maximum ($137,700 in 2020), which ordinarily is adjusted each year. Thus, the percentages in Chart B are comparable within each program, but not across programs.
Both the OASDI and HI annual cost rates rise over the long run from their 2019 levels (13.86 and 3.42 percent). Projected Social Security cost grows to 16.86 percent of taxable payroll in 2042 and to 17.94 percent of taxable payroll in 2094. The projected Medicare HI cost rate rises to 4.96 percent of taxable payroll in 2047, and thereafter remains at about that level to 2094.
The OASDI and HI income rates in Chart B include payroll taxes and taxes on OASDI benefits, but not interest payments. The projected OASDI income rate is stable at about 13 percent throughout the long-range period. The HI income rate rises gradually from 3.34 percent in 2019 to 4.41 percent in 2094 primarily due to the higher payroll tax rates for high earners that began in 2013. Individual tax return filers with earnings above $200,000, and joint return filers with earnings above $250,000, pay an additional 0.9 percent tax on earnings above these earnings thresholds. An increasing fraction of all earnings will be subject to the higher tax rate over time because the thresholds are not indexed. By 2094, an estimated 80 percent of workers would pay the higher rate.
How Will Cost Growth in the Different Parts of Medicare Change the Sources of Program Financing? As Medicare cost grows over time, general revenues and beneficiary premiums will play an increasing role in financing the program. Chart C shows scheduled cost and non-interest revenue sources under current law for HI and SMI combined as a percentage of GDP. The total cost line is the same as displayed in Chart A and shows Medicare cost rising to 6.5 percent of GDP by 2094.
Projected revenue from payroll taxes and taxes on OASDI benefits credited to the HI Trust Fund increases from 1.5 percent of GDP in 2020 to 1.8 percent in 2094 under current law, while projected general revenue transfers to the SMI Trust Fund increase from 1.7 percent of GDP in 2020 to 3.1 percent in 2094, and beneficiary premiums increase from 0.6 to 1.2 percent of GDP during the same period. Thus, the share of total non-interest Medicare income from taxes declines (from 38 percent to 28 percent) while the general revenue share rises (from 44 percent to 50 percent), as does the share of premiums (from 16 percent to 19 percent). The distribution of financing changes in large part because costs for Part B and especially Part D—the Medicare components that are financed mainly from general revenues—increase at a faster rate than Part A cost under the Trustees’ projections. The projected annual HI financial deficits beyond 2035 are 0.4 to 0.5 percent of GDP during 2036-60 and then gradually decline to 0.2 percent of GDP by 2094. There is no provision under current law to finance that shortfall through general revenue transfers or any other revenue source.
Chart C—Medicare Cost and Non-Interest Income by Source as a Percentage of GDP
The law requires that the Board of Trustees determine each year whether the annual difference between program cost and dedicated revenues (the bottom four layers of Chart C) under current law exceeds 45 percent of total Medicare cost in any of the first seven fiscal years of the 75-year projection period. The Trustees Reports for 2006 through 2013, and in 2017 through 2019, contained a determination of “excess general revenue Medicare funding.” Because the current projected difference is expected to exceed the 45 percent threshold in fiscal year 2021, the Trustees are issuing a determination of projected excess general revenue Medicare funding in this year’s report, which is the fourth consecutive year with that determination. Because this determination has been made for at least two consecutive years, a “Medicare funding warning” is triggered, which requires that the President submit to Congress proposed legislation to respond to the warning within 15 days after the submission of the Fiscal Year 2022 Budget. Congress is then required to consider the legislation on an expedited basis.
What are the Budgetary Implications of Rising Social Security and Medicare Costs? Discussion of the long-range financial outlook for Medicare and Social Security often focuses on the reserve depletion dates for the HI and combined OASDI trust funds—the times when the projected trust fund asset reserves under current law will be insufficient to pay the full amounts of scheduled benefits. Normal operations of the trust funds also have an impact on the unified Federal budget.
Under the OASDI and HI programs, when taxes and other sources of revenue are collected in excess of immediate program costs, the excess is invested in Treasury bonds and held in reserve for future periods. Accumulation of reserves in the trust funds improves the unified Federal budget position. When trust fund reserves are drawn down to pay scheduled benefits and expenses, bonds are redeemed and interest payments are made, creating a current-year cost to the unified Federal budget.
SMI differs fundamentally from HI and OASDI in regard to the nature of its financing and the method by which its financial status is evaluated. Unlike HI and OASDI, SMI does not have a trust fund structure with surpluses accumulated from prior years. General revenues finance roughly 75 percent of all SMI costs each year and pose an immediate cost for the unified Federal budget.
Chart D shows the required SMI general revenue funding, plus the excess of scheduled costs over dedicated tax and premium income for the OASDI and HI trust funds expressed as percentages of GDP through 2044. For OASDI and HI, the difference between scheduled cost and dedicated revenues is equal to interest earnings and asset redemptions prior to trust fund depletion, and unfunded obligations after depletion. The chart assumes full benefits will be paid after trust fund depletion, even though under current law expenditures can only be made to the extent covered by current income. Such budgetary assumptions are typical of unified budget baselines, but do not reflect current law in the Social Security Act.
In 2020, the projected difference between Social Security’s expenditures and non-interest income is $73 billion. The Trustees anticipate a deficit of $15 billion in non-interest income for the HI program.2 The projected general revenue demands of SMI are $377 billion. Thus, the total general revenue requirements for Social Security and Medicare in 2020 are $465 billion, or 2.1 percent of GDP. Redemption of trust fund bonds, interest paid on those bonds, and general revenue transfers provide no new net income to the Treasury. When the unified budget is not in surplus, these payments are made through some combination of increased taxation, reductions in other government spending, or additional borrowing from the public.
Chart D—Projected SMI General Revenue Funding
plus OASDI and HI Tax Shorfalls
[Percentage of GDP]
Each of these trust funds’ operations will contribute increasing amounts to Federal unified budget deficits in future years as trust fund bonds are redeemed. Until 2026, interest earnings and asset redemptions, financed from general revenues, will cover the excess of HI expenditures over tax and premium revenues. In addition, general revenues must cover similar payments as a result of growing OASDI bond redemption and interest payments through 2035 as the trust funds are drawn down.
Without a change in law, the OASI, DI, and HI Trust Funds do not have borrowing authority and after depletion of reserves would be unable to pay scheduled benefits in full on a timely basis. However, if full benefits were to be maintained for both Social Security and Medicare, by 2044 the combined OASDI and HI financing gap plus SMI’s projected general revenue demands would equal 4.4 percent of GDP—more than double the 2020 share.
What Is the Outlook for Short-Term Trust Fund Adequacy? The reports measure the short-range adequacy of the OASI, DI, and HI Trust Funds by comparing fund asset reserves at the start of a year to projected costs for the ensuing year (the “trust fund ratio”). A trust fund ratio of 100 percent or more—that is, asset reserves at least equal to projected cost for the year—or reaching 100 percent within 5 years is a good indicator of a fund’s short-range adequacy. That level of projected reserves for any year suggests that even if cost exceeds income, the trust fund reserves, combined with annual tax revenues, would be sufficient to pay full benefits for several years. Chart E shows the trust fund ratios through 2066 under the intermediate assumptions.
Chart E—OASI, DI, and HI Trust Fund Ratios
[Asset reserves as a percentage of annual cost]
By this measure, neither the OASI Trust Fund nor the DI Trust Fund is financially adequate throughout the short-range period (2020-29). The OASI Trust Fund fails the short-range test because its trust fund ratio is projected to decline from 291 percent at the beginning of 2020 to 94 percent at the beginning of 2030. The DI Trust Fund ratio was 62 percent at the beginning of 2020 and is not projected to attain 100 percent within 5 years.
The HI Trust Fund also does not meet the short-range test of financial adequacy; its trust fund ratio was 55 percent at the beginning of 2020 based on the year’s anticipated expenditures, and the projected ratio does not rise to 100 percent within 5 years. Projected HI Trust Fund asset reserves become fully depleted in 2026.
The Trustees apply a less stringent annual “contingency reserve” test to SMI Part B asset reserves because (1) the financing for that account is set each year to meet expected costs, and (2) the overwhelming portion of the financing for that account consists of general revenue transfers and beneficiary premiums, which were 72 percent and 27 percent of total Part B income in calendar year 2019. Part D premiums paid by enrollees and the required amount of general revenue financing are determined each year. Moreover, flexible appropriation authority established by lawmakers for Part D allows additional general revenue transfers if costs are higher than anticipated, limiting the need for a contingency reserve in that account.
What Are Key Dates in OASI, DI, and HI Financing? The 2020 reports project that the OASI and HI Trust Funds will be depleted within 15 years; the anticipated depletion year for the DI Trust Fund is now 2065. Table 4 shows key dates for the respective trust funds as well as for the combined OASDI trust funds. 3
| OASI | DI | OASDI | HI | |
|---|---|---|---|---|
| First year cost exceeds income excluding interesta | 2010 | 2041 | 2010 | 2008 |
| First year cost exceeds total incomea | 2021 | 2047 | 2021 | 2018 |
| Year trust funds are depleted | 2034 | 2065 | 2035 | 2026 |
a Dates indicate the first year a condition is projected to occur and to persist annually thereafter through 2094.
The Trustees project that DI Trust Fund reserves will increase through 2046 before declining annually until they are fully depleted in 2065. At that time, program income would be sufficient to pay 92 percent of scheduled benefits, and 90 percent by 2094.
The OASI Trust Fund, when considered separately, has a projected reserve depletion date of 2034, unchanged from last year’s report. At that time, 76 percent of scheduled OASI benefits would be payable, declining to 71 percent in 2094.
The combined OASI and DI Trust Fund reserves have a projected depletion date of 2035, the same as in last year’s report. After the depletion of reserves, continuing tax income would be sufficient to pay 79 percent of scheduled benefits in 2035, and 73 percent by 2094.
The combined OASI and DI Trust Fund reserves are projected to increase in 2020 because expected total income ($1,116 billion) exceeds anticipated total cost ($1,112 billion). Beginning in 2021, annual total OASDI cost exceeds income by increasing amounts throughout the 75-year projection. Thus, starting in 2021, net redemptions of trust fund asset reserves with General Fund payments will be required to pay scheduled benefits until projected depletion of these reserves in 2035, the same as in last year’s report.
The projected HI Trust Fund depletion date is 2026, the same year as reported last year. Under current law, scheduled HI tax and premium income would be sufficient to pay 90 percent of estimated HI cost after trust fund depletion in 2026, declining to 78 percent by 2044, and then gradually increasing to 90 percent by 2094.
This report projects a decrease in HI Trust Fund asset reserves in 2020 as total cost ($351 billion) is expected to exceed total income ($342 billion). Projected annual HI cost exceeds program income throughout the long-range projection period and assets will decline continuously until depletion of all reserves in 2026.
What is the Long-Range Actuarial Balance of the OASI, DI, and HI Trust Funds? Another way to view the outlook for payroll tax-financed trust funds (OASI, DI, and HI) is to consider their actuarial balances for the 75-year valuation period. The actuarial balance measure includes the trust fund asset reserves at the beginning of the period, an ending fund balance equal to the 76th year’s costs, and projected costs and income during the valuation period, all expressed as a percentage of taxable payroll for the 75-year projection period. Actuarial balance is not an informative concept for the SMI program because Federal law sets premium increases and general revenue transfers at the levels necessary to bring SMI into annual balance.
The actuarial deficit represents the average amount of change in income or cost that is needed throughout the valuation period in order to achieve actuarial balance. The actuarial balance equals zero if cost for the period can be met for the period as a whole and trust fund asset reserves at the end of the period are equal to the following year’s cost. The OASI, DI, and HI Trust Funds all have long-range actuarial deficits under the intermediate assumptions, as shown in the following table.
| OASI | DI | OASDI | HI | |
|---|---|---|---|---|
| Actuarial deficit | 3.14 | 0.07 | 3.21 | 0.76 |
NOTE: Totals do not necessarily equal the sums of rounded components.
For the combined OASI and DI Trust Funds, the annual deficit, expressed as the difference between the cost rate and income rate for a particular year, was 1.03 percent of taxable payroll in 2019. Compared with last year’s report, the Trustees project larger annual deficits for Social Security in all years beginning in 2022, principally due to (1) the recent repeal of the excise tax on high-cost employer sponsored health insurance premiums, which results in slower projected growth in average real covered earnings and payroll tax income, and (2) assumed lower fertility rates and consumer inflation. Lower interest rates have negligible effects on annual deficits. Annual deficits for 2020-94 average 0.37 percentage point higher than in last year’s report. The differences in projected annual deficits between last year’s report and this year’s are small in the 2020s and generally grow until the 2080s. For 2093, the projected annual deficit is 4.48 percent of payroll in this year’s report, compared to 4.11 percent in last year’s report.
Projected annual deficits for the combined OASI and DI programs gradually increase from 0.92 percent of taxable payroll in 2020 to 3.54 percent in 2042. The deficits then decline gradually to 3.46 percent in 2049 before resuming a generally upward trajectory and reaching 4.51 percent of taxable payroll in 2094 (Chart B). The relatively large variation in annual deficits indicates that a single tax rate increase for all years starting in 2020 sufficient to achieve actuarial balance would result in sizable annual surpluses early in the period followed by increasing deficits in later years. Sustainable solvency would require payroll tax rate increases or benefit reductions (or a combination thereof) by the end of the period that are substantially larger than those needed on average for this report’s long-range period (2020-94).
In 2019, the HI annual deficit was 0.08 percent of taxable payroll, continuing its downward trend since 2010, but is expected to rise to 0.16 percent in 2020. Projected annual deficits then increase gradually to 1.08 percent of taxable payroll by 2045, before generally declining to 0.50 percent in 2094. The HI cost rate has generally declined since 2010 as the economy has recovered from the 2007-09 recession, while health care cost growth rates have been low. Starting in 2020, the Trustees expect annual HI deficits to increase as cost rates grow faster than income rates. The cost rate is expected to increase primarily due to rising per beneficiary spending and the aging of the baby boom population. Throughout the long-range period, cost rate growth is constrained by the productivity reductions in provider payments, and income rates continue to increase as a larger share of earnings becomes subject to the additional 0.9 percent payroll tax and a larger share of Social Security benefits becomes subject to income tax that is credited to the HI Trust Fund.
The financial outlooks for both OASDI and HI depend on a number of demographic and economic assumptions. Nevertheless, the actuarial deficit in each of these programs is large enough that averting trust fund depletion under current-law financing is extremely unlikely. An analysis that allows plausible random variations around the intermediate assumptions employed in the report indicates that OASDI trust fund depletion is highly probable before mid-century.
How Has the Financial Outlook for Social Security and Medicare Changed Since Last Year? Under the intermediate assumptions, the combined OASDI trust funds have a projected 75-year actuarial deficit equal to 3.21 percent of taxable payroll, compared with the 2.78 percent figure reported last year. The projected depletion date for the combined asset reserves is 2035, the same as in last year’s report. Advancing the valuation period by one year to include 2094, a year with a large negative balance, alone increased the actuarial deficit by 0.05 percent of taxable payroll. Changes in law (repeal of the excise tax on high-cost employer provided health insurance plans), methods, starting values, and assumptions (in particular, lower anticipated fertility rates, consumer inflation, and interest rates) combined to increase the actuarial deficit by an additional 0.38 percent of taxable payroll.
The long-range actuarial deficit for the DI Trust Fund is now 0.07 percent of taxable payroll, down from 0.12 percent projected in last year’s report. Since 2010, disability applications have declined substantially and the number of disabled-worker beneficiaries has been falling since 2014. In light of this experience, and in consideration of long-term averages, in this report the Trustees have lowered the ultimate age-sex-adjusted disability incidence rate assumption from 5.2 to 5.0 per thousand exposed workers.
Medicare’s HI Trust Fund has a long-range actuarial deficit equal to 0.76 percent of taxable payroll under the intermediate assumptions, 0.15 percentage point lower than reported last year. The anticipated date of depletion of the HI Trust Fund remains 2026. HI income is projected to be lower than last year’s estimates due to lower payroll tax revenue. In addition, HI expenditures are expected to be lower than last year’s estimates throughout the short-range period because of lower-than-projected 2019 spending, lower projected provider payment updates, and the incorporation of time-to-death into the demographic factors used in the projections model.
Due to the nature of the financing for both parts of SMI, each account is separately in financial balance under current law, as they were last year. Projected Part B costs are somewhat higher than those in last year’s report due to higher spending for Part B drugs and higher spending for Medicare Advantage beneficiaries. In contrast, projected Part D spending is lower than in last year’s report because of slower overall drug price increases and higher direct and indirect remuneration (payments primarily consisting of rebates negotiated by Part D plans). SMI spending was 2.2 percent of GDP in 2019, and is now expected to increase to 4.4 percent of GDP in 2093. In last year’s report, SMI spending was estimated to be 4.2 percent of GDP in 2093.
How Are Social Security and Medicare Financed? For OASDI and HI, the major source of financing is payroll taxes on earnings paid by employees and their employers. Self-employed workers pay the equivalent of the combined employer and employee tax rates. During 2019, an estimated 177.9 million people had earnings covered by Social Security and paid payroll taxes; for Medicare the corresponding figure was 181.9 million. Current law establishes payroll tax rates for OASDI, which apply to earnings up to an annual maximum ($137,700 in 2020) that ordinarily increases with the growth in the nationwide average wage. In contrast to OASDI, covered workers pay HI taxes on total earnings. The scheduled payroll tax rates (in percent) for 2020 are shown in Table 6.
| OASI | DI | OASDI | HI | Total | |
|---|---|---|---|---|---|
| Employees | 5.30 | 0.90 | 6.20 | 1.45 | 7.65 |
| Employers | 5.30 | 0.90 | 6.20 | 1.45 | 7.65 |
| Combined total | 10.60 | 1.80 | 12.40 | 2.90 | 15.30 |
There is an additional HI tax equal to 0.9 percent of earnings over $200,000 for individual tax return filers, and on earnings over $250,000 for joint return filers.
Taxation of Social Security benefits is another source of income for the Social Security and Medicare trust funds. Beneficiaries with incomes above $25,000 for individuals (or $32,000 for married couples filing jointly) pay income taxes on up to 50 percent of their benefits, with the revenues going to the OASDI trust funds. This income from taxation of benefits made up about 3 percent of Social Security’s income in 2019. Those with incomes above $34,000 (or $44,000 for married couples filing jointly) pay income taxes on up to 85 percent of benefits, with the additional revenues going to the Medicare trust fund. This income from taxation of benefits made up about 7 percent of HI Trust Fund income in 2019.
The trust funds also receive income from interest on their accumulated reserves, which are invested in U.S. Government securities. In 2019, interest income made up 8 percent of total income to the OASDI trust funds, 2 percent for HI, and less than 1 percent for SMI.
Payments from the General Fund financed about 72 percent of SMI Part B and Part D costs in 2019, with most of the remaining costs covered by monthly premiums charged to enrollees or in the case of low-income beneficiaries, paid on their behalf by Medicaid for Part B and Medicare for Part D. Part B and Part D premium amounts are determined by methods defined in law and increase as the estimated costs of those programs rise.
In 2020, the Part B standard monthly premium is $144.60. There are also income-related premium surcharges for Part B beneficiaries whose modified adjusted gross income exceeds a specified threshold. In 2020, the threshold is $87,000 for individual tax return filers and $174,000 for joint return filers. Income-related premiums range from $57.80 to $347.00 per month in 2020.
In 2020, the Part D “base monthly premium” is $32.74. Actual premium amounts charged to Part D beneficiaries depend on the specific plan they have selected and average around $30 for standard coverage. Part D enrollees with incomes exceeding the thresholds established for Part B must pay income-related monthly adjustment amounts in addition to their normal plan premium. For 2020, the adjustments range from $12.20 to $76.40 per month. Part D also receives payments from States that partially compensate for the Federal assumption of Medicaid responsibilities for prescription drug costs for individuals eligible for both Medicare and Medicaid. In 2020, State payments cover about 12 percent of Part D costs.
Who Are the Trustees? There are six Trustees, four of whom serve by virtue of their positions in the Federal Government: the Secretary of the Treasury, the Secretary of Labor, the Secretary of Health and Human Services, and the Commissioner of Social Security. The other two Trustees are public representatives appointed by the President, subject to confirmation by the Senate. The two Public Trustee positions have been vacant since July 2015.
2 This difference is projected on a cash rather than the incurred expenditures basis applied elsewhere in the long-range projections, except where explicitly noted otherwise.
3 HI results in this section of the Summary are on a cash rather than the incurred expenditures basis.
A MESSAGE FROM THE PUBLIC TRUSTEES
Because the two Public Trustee positions are currently vacant, there is no Message from the Public Trustees for inclusion in the Summary of the 2020 Annual Reports.