Retirement Implications of a Low Wage Growth, Low Real Interest Rate Economy
Social Security Bulletin, Vol. 80 No. 3, 2020
We use a lifecycle model to examine the implications of persistent low real interest rates and low wage growth for individuals nearing retirement. We find that low returns and low wage growth affect welfare substantially, often producing large compensating variations. Low economywide wage growth has a much larger welfare effect than low individual wage growth, largely because the Social Security benefit formula is progressive and incorporates wage indexing. Low economywide wage growth undercuts the effects of wage indexation as average wages fall along with individual wages. Low returns raise the optimal Social Security claiming age and the marginal benefit of working longer, while low wage growth decreases the marginal benefit of working longer. Low returns also increase the relative price of consumption during retirement, suggesting that individuals may wish to reduce future consumption relative to current consumption. We also compare these results with standard financial planning advice.
Jason Scott is the Managing Director of JS Retirement Consulting. John Shoven is a professor emeritus of economics at Stanford University and a researcher at the National Bureau of Economic Research (NBER). Sita Slavov is a professor in the Schar School of Policy and Government at George Mason University, a researcher at NBER, and a visiting scholar at the American Enterprise Institute. When this article was written, John Watson was with Edelman Financial Engines.
Acknowledgments: We are grateful for helpful comments from John Sabelhaus and participants at the 2018 Stanford Institute for Economic Policy Research Conference on Working Longer and Retirement. We thank Kyung Min Lee for excellent research assistance. A previous version of this article was published as National Bureau of Economic Research Working Paper No. 25556 (https://www.nber.org/papers/w25556).
Note: This research was supported by the Alfred P. Sloan Foundation through grant #G-2017-9695.
The findings and conclusions presented in the Bulletin are those of the authors and do not necessarily represent the views of the Social Security Administration or the NBER.
Introduction
| AIME | average indexed monthly earnings |
| AWI | average wage index |
| FRA | full retirement age |
| PIA | primary insurance amount |
| WWI | worker's wage index |
Real interest rates (net of inflation) have remained persistently low for the last decade. Yields on 10- and 20-year Treasury Inflation Protected Securities have averaged less than 1 percent since the start of 2010 (Department of the Treasury 2020). The macroeconomics literature has attempted to explain this phenomenon by arguing that the natural rate of interest (also known as r-star)—the real, safe short-term interest rate that is neither expansionary nor contractionary—has declined considerably since 2000 and has been close to zero since 2008 (Laubach and Williams 2003, 2015). A related concept is the growth rate of potential output. Macroeconomic models that estimate r-star also suggest that the growth rate of potential output has fallen over the last 10 years. Persistently low economic growth translates into persistently low real wage growth.1
These macroeconomic shifts have important implications for retirement planning and security. Two key aspects of any retirement plan are future rates of return on retirement assets and future wage growth rates. In this article, we use a lifecycle model to simulate the effects of low real interest rates and economywide real wage growth on the retirement planning and well-being of individuals in their 50s today. We find that low real interest rates increase the Social Security claiming ages that maximize utility. Low economic growth (characterized by both low interest rates and low real wage growth) depresses optimal saving rates close to retirement and reduces consumption in retirement.2 For any given retirement age, low economic growth also increases the marginal benefit of working an additional year, suggesting that working longer is part of an optimal response to the current macroeconomic environment.3
We further demonstrate that the low economywide rate of wage growth has a much stronger adverse effect on retirement well-being than low individual wage growth. Social Security benefits are calculated by applying a progressive benefit formula to the highest 35 years of earnings indexed to economywide wage growth. Specifically, earnings prior to age 60 are indexed by dividing them by the economywide average wage during the year in which they were earned and then multiplying the result by the economywide average wage at age 60. (Earnings during and after the year in which the worker attains age 60 count at their nominal value.) If individual wage growth is lower than expected while economywide wage growth remains constant, the individual's projected earnings trajectory declines but the indexation of earnings does not change. The decline in wage growth affects only a portion of the worker's average indexed earnings (the portion occurring after wage growth slows), and the progressive benefit formula ensures that Social Security benefits are affected less than proportionately. On the other hand, if low individual wage growth reflects low economywide wage growth, the individual's position and the economywide average wage move in tandem and the progressive benefit formula provides no insurance benefit. Moreover, all years of the worker's wages are indexed to a lower benchmark, which exacerbates the effect of low personal wage growth on retirement income.
Economists often analyze retirement planning using a lifecycle model, a conceptual framework designed to capture the key elements of those planning decisions. A lifecycle model simulates an individual's or household's long-term experiences and assumptions, and the decisions about labor supply, saving, and consumption that are meant to maximize expected utility over the remaining lifetime. These plans can be updated in subsequent periods as new information becomes available. A standard property of lifecycle models is that individuals aim to smooth consumption over their lifetime—that is, to avoid sharp changes in their standard of living despite income fluctuations—accounting for the relative prices of current and future consumption, as determined by the interest rate. A large body of literature examines various insights revealed by the lifecycle model. One well-known finding is that a decrease in lifetime income, possibly arising through lower wage growth, reduces consumption in every future period (Friedman 1957; Modigliani 1966). Individuals smooth their consumption by reducing their standard of living, both in the present and after retirement. Another standard finding is that saving behavior is subject to two conflicting influences, an income effect and a substitution effect, when the rate of return on saving decreases. The income effect encourages lower consumption both immediately and in the future. Because current consumption falls and labor income is held constant, saving increases. The substitution effect works in the opposite direction, causing a reduction in saving because the return has declined; that is, individuals choose to consume more in the present and less in the future.4 When individuals face liquidity constraints and uncertainty about income, they may use wealth as a buffer stock against future income fluctuations (Deaton 1991; Carroll 1997). Closely related to the themes of our research, Carroll (2009) finds that a reduction in wage growth lowers saving rates as individuals need a smaller buffer stock of wealth.
The extent to which the lifecycle model accurately describes retirement behavior has been debated in the literature, and numerous authors have added different features to the basic model in order to bridge the gap between theory and data.5 For example, Shefrin and Thaler (1988) add behavioral features such as self-control, mental accounting, and framing. For this analysis, we use a standard lifecycle model with no behavioral features. Our model is at odds with some aspects of observed behavior; for example, it suggests that Social Security should be claimed at age 68, although most individuals claim at younger ages. One motivation for using a standard lifecycle model is that its predictions for the current economic environment lay the groundwork for further research into how and why actual behavior deviates from these predictions. Another motivation is that the principles of the lifecycle model are sometimes used prescriptively to provide advice about what individuals could do when faced with low returns. Although we take no position on whether individuals should behave according to findings of the lifecycle model, we note that financial planners often assume that individuals wish to smooth consumption (maintain a consistent standard of living) and respond rationally to changes in their economic environment. As discussed by Shefrin and Thaler (1988), the standard lifecycle model is appropriate for that purpose, although behavioral features may be needed to explain why actual behavior deviates from its predictions. Thus, a lifecycle model can help inform financial planning advice.
In this context, our work contributes to the discussion on the extent to which standard financial planning advice is or should be consistent with the lifecycle model.6 Financial planning often relies on a target replacement rate; that is, the share of preretirement income that needs to be replaced during retirement to meet the goal of maintaining one's standard of living in retirement. That goal is consistent with consumption smoothing, suggesting that a lifecycle model can help identify the appropriate target replacement rate. Indeed, Scholz and Seshadri (2009) derive optimal replacement rates and other financial planning guidelines from a lifecycle model. They show that the median optimal replacement rate is 68 percent of average household lifetime earnings, which is consistent with standard financial planning recommendations. However, individual optimal replacement rates vary greatly depending on income level, number of children, and other characteristics. Thus, standard rules of thumb for the target replacement rate—even if they are chosen because they are accurate for the median household—are not optimal for most households analyzed with a lifecycle model. Our results can similarly help inform financial planning guidelines. As we will discuss later, the results derived from our standard lifecycle model are at odds with common financial planning advice regarding the optimal response to low returns. In particular, our work suggests that replacement rate targets should be adjusted when interest rates or wage growth change.
Lifecycle models have been used to study a range of retirement behavior. For example, Haan and Prowse (2014) and Gustman and Steinmeier (2008, 2015) examine the effects of changes in Social Security or pension claiming rules on consumption and retirement behavior. In the study most closely related to this article, Horneff, Maurer, and Mitchell (2018) examine the effect of persistently low real asset returns on lifecycle consumption and retirement behavior. Their model is calibrated to the U.S. economy and shows that low real returns cause individuals to save less in tax-preferred accounts and more in taxable accounts; overall, saving declines. In addition, individuals claim Social Security benefits later. Bronshtein and others (2019) do not use a lifecycle model but show that working 3–6 months longer, and delaying Social Security over that period, has the same effect on retirement living standards as saving an extra 1 percent of earnings over 30 years. The closer one is to retirement, and the lower one's real asset returns, the greater the relative effect of working longer.
This article extends the work of Horneff, Maurer, and Mitchell (2018) by exploring the implications of low wage growth in conjunction with low interest rates. Low economywide wage growth has important implications for retirement income given its interaction with the Social Security benefit formula. For a retiree aged 62, for example, low economywide wage growth affects economic well-being more than low individual wage growth does—by roughly 65 percent. We consider the optimal strategies for individuals who are approaching retirement (aged 55) and estimate the welfare cost of low real interest rates and wage growth. Expanding on Bronshtein and others (2019), we formally show lifecycle model estimates indicating that the marginal benefit of additional work increases in a low-return environment. This effect is even larger when individuals follow the commonly observed behavior of claiming Social Security upon retirement (Shoven, Slavov, and Wise 2018) rather than at the optimal claiming age. Individuals who make retirement decisions by comparing the marginal benefit of deferring retirement to the marginal cost of effort are likely to work longer.
Our work is also related to the extensive literature examining the tradeoffs involved in choosing Social Security claiming dates and the effect of recent low real interest rates on those tradeoffs (for example, Meyer and Reichenstein 2010; Munnell and Soto 2005; Sass, Sun, and Webb 2007, 2013; Coile and others 2002; Mahaney and Carlson 2007; Shoven and Slavov 2014a, 2014b; and Kotlikoff, Moeller, and Solman 2015). Most of these works use straightforward expected present-value calculations rather than lifecycle models. Among the key findings of this literature is that delaying Social Security claiming, often to age 70, substantially increases the expected present value of benefits for sizable groups such as married primary earners. At historical interest rates, delay does not produce large gains for single men, workers with higher-than-average mortality, or married secondary earners. But when real interest rates are close to zero, some degree of delay becomes actuarially advantageous for most people. Our findings are consistent with this prior research and show that low interest rates indeed delay optimal claiming under a lifecycle framework with liquidity constraints (that is, with limits on the amount that can be borrowed).
This article is arranged in five sections, including this introduction. The second section describes our lifecycle model and its calibration. The third section discusses our results. The fourth section compares the recommendations of lifecycle model analysis in a low-growth scenario with standard financial planning advice. The fifth section concludes.
Lifecycle Model
In the two subsections that follow, we describe the standard lifecycle model with which we examine the potential effects of low wage growth and low interest rates on the saving and consumption strategies of late-career workers. The first subsection addresses the model assumptions and the second describes its parameters and data sources. To supplement the description presented here, we provide the mathematical details of the model in Appendix A.
Assumptions
In the model, we assume that individuals begin working at age 20 and work continuously until an exogenous retirement age. Within each period, individuals decide how much of their labor income to consume and how much to save, with the goal of maximizing the present value of lifetime utility. The utility function in each period exhibits constant relative risk aversion. We assume that individuals do not borrow, and that they invest any accumulated savings in actuarially fair annuities. Individuals face mortality risk in each period and can live to a maximum age of 110. They are eligible for Social Security, which can be claimed at any age between 62 and 70 (with the appropriate actuarial adjustment or delayed retirement credits applied).7 However, we assume that the Social Security retirement earnings test effectively prevents those who are currently working from claiming before full retirement age (FRA).8
The individuals in our model are aged 54 in 2019. Under the baseline case, these individuals assume that future interest rates and wage growth will be in line with the average of past values for those variables (described in detail in the following subsection). Alternative scenarios involve a lower real interest rate and lower wage growth in the future. We determine the initial level of assets for the 54-year-old individuals we model by applying the same model to a 20-year-old individual and using a historical series of wages and interest rates (through 2018) combined with the baseline-case projections. As detailed in Appendix A, we assume that the 20-year-old perfectly predicts the historical wage and interest rate series and, like the 54-year-old, assumes that these variables will follow their baseline paths thereafter. (Even if foresight of the historical series is not literally perfect, this assumption provides a ballpark figure for initial assets at age 54.)
Social Security benefits are based on the average of the worker's highest 35 years of earnings, indexed for economywide wage growth though age 60 (with earnings at ages 60 and older indexed to 1.0; that is, counted at their nominal value.) This annual average, divided by 12 to convert to a monthly rate, is called average indexed monthly earnings (AIME). A progressive benefit formula is applied to AIME to obtain the primary insurance amount (PIA), or the monthly benefit payable at FRA (67 for an individual aged 54 in 2019). The progressive benefit formula has two thresholds, or “bend points,” that are indexed to the economywide average wage. Individuals receive 90 percent of their AIME up to the first bend point ($895 in 2018), 32 percent of any AIME above the first bend point up to the second ($5,397 in 2018), and 15 percent of any additional AIME. The benefit formula uses the bend points for the year in which the individual turns 62. We allow earnings after claiming to affect the AIME (assuming they are among the highest 35 years). Social Security benefits are adjusted based on claiming age. Individuals born in 1960 or later who claim on reaching age 62 will receive 70 percent of their PIA, and that percentage increases with each month they delay claiming.9 To simplify our calculations, however, we assume claims take place on birthdays, which allows for nine possible claiming ages (62 through 70).
Our model incorporates two important simplifying assumptions. The first is that the individual perceives no uncertainty in the baseline scenario and assumes deterministic paths for interest rates and wages. In other words, the individual does not anticipate the late-career shock to both series from the shift to a low-growth economy. A realistic model would incorporate uncertainty and period-to-period fluctuations in both series. However, modeling uncertainty about the key macroeconomic shifts we consider—in the real interest rate and long-term real wage growth—is challenging. Thus, we treat these shifts as one-off surprises: they are completely unanticipated, and once they happen, the individual expects them to be permanent. Because this simple deterministic model reflects a basic intuition about long-term shifts in interest rates and wage growth, it is likely to capture the view of the recent low-growth environment among many people who are approaching retirement today.10
Second, we assume that there is no labor supply decision or cost of effort. Rather, the individual is assumed to work full time until an exogenous retirement date. We can still estimate the effects of career length by examining the increase in economic well-being when the individual is able to work for another year. This quantity is the marginal benefit from extending working life and is necessarily positive in our model as we assume there is no cost of effort. In a model with endogenous labor supply, the individual would compare this quantity to the cost of effort in the additional year of work. Thus, examining how this quantity changes can provide some insight into the direction of adjustment if labor supply were endogenous.
Parameter Choices
The model accounts for mortality rates using data from the cohort mortality tables underlying the intermediate assumptions in The 2013 Annual Report of the Board of Trustees of the Federal Old-Age and Survivors Insurance and Federal Disability Insurance Trust Funds. The Trustees Report mortality tables extend through age 120; however, because survival probabilities beyond age 110 are very small, we truncate the distribution at 110 by assuming a zero probability of survival to age 111. The model analyzes stylized single men in the 1965 birth cohort, who are therefore aged 54 in 2019 and have a Social Security FRA of 67.11 The men are assumed to enter the labor force at age 20 and work full time until retirement. Our initial calculations assume a retirement age of 65 for the stylized worker. However, we also perform calculations for alternative retirement ages. We set the baseline real interest rate at 3 percent, the alternative (low) real interest rate at 1 percent, and the subjective discount rate for future utility at 3 percent.12
Social Security cost-of-living adjustments are based on the Bureau of Labor Statistics' Consumer Price Index for Urban Wage Earners and Clerical Workers (CPI-W). We model inflation using this index. For 1985 (the year a worker reaches age 20) through 2018, we use the historical average monthly CPI-W values for the third quarter to calculate a year-over-year inflation rate (2.55 percent annual growth for workers born in 1965). From 2019 forward, the CPI-W is assumed to increase at a constant rate; that is, the forecasted inflation rate. For the baseline case, we assume forecasted inflation rises 2.5 percent annually, similar to the historical average for the 1965 cohort. All monetary amounts are expressed in 2018 dollars.
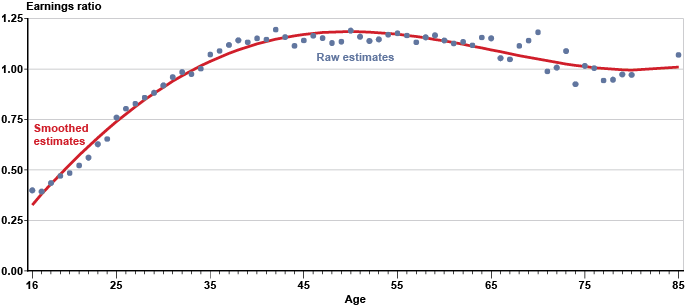
We construct an age-earnings profile based on the Center for Economic Policy Research's Uniform Current Population Survey (CPS) Extracts.13 We use the 2016 Outgoing Rotation Groups file, which includes the subset of monthly CPS respondents who are asked detailed questions about hours and earnings. This file contains a consistent hourly wage variable (rw_ot), the construction of which is detailed in Schmitt (2003). We multiply this hourly wage variable by 2,000 (roughly the number of hours in a full-time working year) to impute full-time annual earnings for each worker. We divide each worker's full-time annual earnings by economywide full-time annual earnings (that is, the average value of this variable for all individuals in the dataset). We then calculate average relative annual earnings by age. Because this age-earnings profile is not smooth, particularly at older ages when the sample of workers is small, we smooth it by regressing age-specific average earnings on a fifth-order polynomial in age and using the predicted values for the estimation. This procedure gives us predicted full-time earnings at each age relative to economywide earnings. Chart 1 shows the relative age-earnings profile. It suggests that most age-related wage growth occurs early in the average worker's career. At older ages, real earnings growth occurs primarily via economywide wage growth.
Individual earnings relative to economywide average earnings, by age: Raw and regression-adjusted (smoothed) estimates for full-time workers in 2016
| Age | Raw estimate | Smoothed estimate |
|---|---|---|
| 16 | 0.399 | 0.327 |
| 17 | 0.392 | 0.379 |
| 18 | 0.435 | 0.430 |
| 19 | 0.470 | 0.479 |
| 20 | 0.484 | 0.526 |
| 21 | 0.522 | 0.572 |
| 22 | 0.561 | 0.616 |
| 23 | 0.627 | 0.659 |
| 24 | 0.653 | 0.700 |
| 25 | 0.759 | 0.739 |
| 26 | 0.803 | 0.777 |
| 27 | 0.828 | 0.813 |
| 28 | 0.858 | 0.847 |
| 29 | 0.882 | 0.880 |
| 30 | 0.919 | 0.910 |
| 31 | 0.960 | 0.939 |
| 32 | 0.985 | 0.966 |
| 33 | 0.975 | 0.992 |
| 34 | 1.001 | 1.016 |
| 35 | 1.072 | 1.038 |
| 36 | 1.090 | 1.058 |
| 37 | 1.119 | 1.077 |
| 38 | 1.142 | 1.094 |
| 39 | 1.133 | 1.110 |
| 40 | 1.152 | 1.124 |
| 41 | 1.146 | 1.137 |
| 42 | 1.195 | 1.148 |
| 43 | 1.158 | 1.157 |
| 44 | 1.115 | 1.165 |
| 45 | 1.142 | 1.172 |
| 46 | 1.165 | 1.177 |
| 47 | 1.153 | 1.181 |
| 48 | 1.129 | 1.184 |
| 49 | 1.135 | 1.185 |
| 50 | 1.190 | 1.186 |
| 51 | 1.160 | 1.185 |
| 52 | 1.139 | 1.183 |
| 53 | 1.147 | 1.180 |
| 54 | 1.170 | 1.177 |
| 55 | 1.177 | 1.172 |
| 56 | 1.166 | 1.167 |
| 57 | 1.133 | 1.161 |
| 58 | 1.157 | 1.154 |
| 59 | 1.167 | 1.147 |
| 60 | 1.142 | 1.139 |
| 61 | 1.127 | 1.131 |
| 62 | 1.135 | 1.122 |
| 63 | 1.117 | 1.113 |
| 64 | 1.156 | 1.104 |
| 65 | 1.152 | 1.095 |
| 66 | 1.054 | 1.086 |
| 67 | 1.048 | 1.076 |
| 68 | 1.115 | 1.067 |
| 69 | 1.141 | 1.058 |
| 70 | 1.182 | 1.049 |
| 71 | 0.988 | 1.041 |
| 72 | 1.007 | 1.033 |
| 73 | 1.089 | 1.025 |
| 74 | 0.925 | 1.018 |
| 75 | 1.016 | 1.012 |
| 76 | 1.004 | 1.007 |
| 77 | 0.943 | 1.003 |
| 78 | 0.947 | 0.999 |
| 79 | 0.973 | 0.997 |
| 80 | 0.971 | 0.995 |
| 85 | 1.070 | 1.009 |
A worker's nominal wages from 1985 through 2016 are modeled as the product of the age-earnings profile and the historical Social Security average wage index (AWI) for that year.14 For 2017 and 2018, we estimate the AWI using the nominal annual growth rate that the worker experienced over his working life (3.5 percent for workers born in 1965). From 2019 through retirement, the worker's estimated wages are the product of the age-earnings profile and a quantity we refer to as the worker's wage index (WWI), which increases at a constant rate. Growth in the WWI represents growth in the worker's individual wage, holding age constant. Similarly, the AWI, which is used to compute AIME, is assumed to increase at a constant rate from 2019 forward. Note that the WWI and the AWI may differ. The AWI reflects all workers economywide, whereas the WWI reflects an individual worker. For the baseline case, we assume that AWI and WWI are equal and rise at 3.5 percent annually, in line with historical growth for the 1965 cohort. The various low wage-growth scenarios reduce one or both assumed growth rates to 2.5 percent, equal to the assumed value for long-term inflation, resulting in zero real wage growth.
Results
In this section, we present our findings—first, in the context of comparing decisions arising from alternative economic conditions; then, with a focus on the relationships between individual and economywide wage growth.
Reevaluating Saving, Claiming, and Work Decisions
Table 1 shows the optimal consumption paths assuming a retirement age of 65. We show optimal consumption at ages 54 and 110 as well as annual average optimal consumption over the range of ages 54–110. Because the discount rate is equal to the real interest rate in the baseline scenario, consumption is constant over the life cycle and therefore the same at all ages ($49,528). Assets reach a maximum of $404,649 at age 65 and the optimal Social Security claiming age is 68 (not shown). Because the liquidity constraint does not bind—that is, because the individual has positive wealth, and the inability to borrow is therefore irrelevant—and actuarially fair annuities are available, the optimal claiming age is that which maximizes the expected net present value of Social Security wealth. Calculating the optimal claiming age depends only on Social Security rules, mortality, and the real interest rate.
| Age | Baseline scenario a | Change from baseline under alternative scenarios | |||
|---|---|---|---|---|---|
| Low interest rate b (scenario 1) | Low economywide wage growth c (scenario 2) | Low interest rate and low economy-wide wage growth d (scenario 3) | Low individual wage growth e (scenario 4) | ||
| 54 | 49,528 | 294 | -2,407 | -2,301 | -1,770 |
| Annual average for ages 54–110 | 49,528 | -7,798 | -2,407 | -9,972 | -1,770 |
| 110 | 49,528 | -14,977 | -2,407 | -16,777 | -1,770 |
| SOURCE: Authors' calculations using the methodology described in the Lifecycle Model section. | |||||
| NOTE: All scenarios assume retirement at age 65 and 2.5 percent annual inflation. | |||||
| a. Annual real interest rate = 3.0 percent; AWI and WWI annual real growth rates = 3.5 percent. | |||||
| b. Annual real interest rate = 1.0 percent; AWI and WWI annual real growth rates = 3.5 percent. | |||||
| c. Annual real interest rate = 3.0 percent; AWI and WWI annual real growth rates = 2.5 percent. | |||||
| d. Annual real interest rate = 1.0 percent; AWI and WWI annual real growth rates = 2.5 percent. | |||||
| e. Annual real interest rate = 3.0 percent; AWI annual real growth rate = 3.5 percent; WWI annual real growth rate = 2.5 percent. | |||||
We compare the baseline case with four alternative scenarios.
- Low interest rate: The real interest rate is 1 percent. (AWI and WWI rise at 3.5 percent.)
- Low economywide wage growth: AWI and WWI rise at 2.5 percent—equal to assumed inflation. (The real interest rate is 3 percent.)
- Low interest rate and low economywide wage growth: The real interest rate is 1 percent; AWI and WWI rise at 2.5 percent—equal to assumed inflation.15
- Low individual wage growth: WWI rises at 2.5 percent (the rate of inflation) while AWI continues to rise at 3.5 percent. (The real interest rate is 3 percent.)
In Table 1, scenario 1 shows the deviation from baseline consumption that occurs when the real interest rate decreases to 1 percent. The results suggest an initial increase in consumption of $294 and subsequent declines, by amounts that average $7,798 annually and reach a final level of $14,997, over the remaining lifetime. As discussed earlier, a change in the interest rate has both income and substitution effects. In the baseline scenario, the interest rate (reflecting opportunity cost of present consumption relative to future consumption) and the subjective discount rate (reflecting the utility benefit of present consumption relative to future consumption) are equal, and the lifecycle model predicts constant lifetime consumption. When the interest rate declines below the subjective discount rate, the substitution effect drives the individual to shift consumption toward the present and to save less because the return on saving has declined, making current consumption less expensive relative to future consumption. Holding the path of income constant, increased current consumption necessarily results in lower future consumption; thus, there is a downward sloping consumption path. The income effect causes the individual to lower consumption in all periods. At age 54, the substitution effect dominates the income effect; therefore, consumption increases and saving decreases.
When both individual and economywide wage growth decline (scenario 2), consumption drops by $2,407 at all ages. In this case, lifetime income has decreased but the relative cost of future consumption (that is, the interest rate) has not changed. Thus, there is only an income effect. Consumption declines in all periods, but the consumption profile remains flat. When individual wage growth, economywide wage growth, and the real interest rate all decline (scenario 3), consumption drops, both initially and over the remainder of the individual's life. In this case, the decreasing interest rate generates both the income and substitution effects described above, and the decrease in wage growth creates the income effect described above. Thus, there is a drop in average consumption as well as a change in the slope of the consumption profile that shifts consumption toward the present. With a real interest rate of 1 percent, scenario 1 increases the optimal claiming age to 70 (not shown). However, in scenario 2, where the real interest rate remains at the baseline value of 3 percent, the optimal claiming age is 68. If the individual's wage growth declines (scenario 4), the decline in consumption is smaller than that of scenario 2, in which both economywide and individual wage growth decline to 2.5 percent. Annual consumption declines by only $1,770 in alternative scenario 4, compared with $2,407 in alternative scenario 2.
We next explore the welfare effects of each of these changes by calculating their compensating variation, or the amount of additional wealth that the worker would need to receive at age 54 in the new scenario to restore lifetime utility to the baseline level. Appendix A presents the equation for calculating compensating variation, which is an intuitive measure of the change in the individual's economic well-being. Table 2 indicates the compensating variation of the shift from the baseline assumption to each of the four alternative scenarios. For comparison, the baseline estimate of initial wealth at age 54 is $141,002. Relative to initial assets, the compensating variations are large, particularly in scenarios 1–3. For example, for retirement at age 65, the compensating variation for the low interest rate scenario ($97,341) is more than two-thirds of initial assets. The compensating variation for low economywide real wage growth ($45,972) is around one-third of initial assets. A shock to both economywide wages and real interest rates (scenario 3) has a greater compensating variation ($156,703) than the sum of the compensating variations for each of the shocks individually. In comparison, the compensating variation for a shock to individual wage growth is milder, between 61 percent and 83 percent of the compensating variation for a shock to economywide wage growth, depending on retirement age.
| Retirement age | Low interest rate a (scenario 1) | Low economywide wage growth b (scenario 2) | Low interest rate and low economywide wage growth c (scenario 3) | Low individual wage growth d (scenario 4) |
|---|---|---|---|---|
| 62 | 108,362 | 32,606 | 151,497 | 19,813 |
| 63 | 105,457 | 36,789 | 153,538 | 24,150 |
| 64 | 101,715 | 41,229 | 155,249 | 28,821 |
| 65 | 97,341 | 45,972 | 156,703 | 33,796 |
| 66 | 92,415 | 50,988 | 158,170 | 39,042 |
| 67 | 86,966 | 56,168 | 159,327 | 44,531 |
| 68 | 80,702 | 61,562 | 160,291 | 50,156 |
| 69 | 74,073 | 67,103 | 161,159 | 55,983 |
| SOURCE: Authors' calculations using the methodology described in the Lifecycle Model section. | ||||
| NOTE: All scenarios assume 2.5 percent annual inflation. | ||||
| a. Annual real interest rate = 1.0 percent; AWI and WWI annual real growth rates = 3.5 percent. | ||||
| b. Annual real interest rate = 3.0 percent; AWI and WWI annual real growth rates = 2.5 percent. | ||||
| c. Annual real interest rate = 1.0 percent; AWI and WWI annual real growth rates = 2.5 percent. | ||||
| d. Annual real interest rate = 3.0 percent; AWI annual real growth rate = 3.5 percent; WWI annual real growth rate = 2.5 percent. | ||||
Like Table 2, Table 3 presents measures of the change in economic well-being as of eight retirement ages. Because retirement age is a worker's choice (unless external factors force the decision), working longer can mitigate some of the welfare cost of low growth. Table 3 indicates the value—or wealth equivalent—of delaying retirement by an additional year for initial retirement ages of 62 through 69. Again, Appendix A presents the equation for calculating this wealth equivalent—which is the amount of additional wealth the individual would need to receive today if forced to retire at age t rather than being allowed to work until age t+1. In other words, it is the compensating variation of being forced to retire at age t rather than t+1. For example, Table 3 shows that under the baseline scenario, an individual who must retire at 65 would need to receive an additional $43,796 at retirement to have the same lifetime utility as someone who is able to work until age 66. When interest rates are low (alternative scenario 1), an individual who retires at 65 must receive $54,935 today to realize the same lifetime utility as someone who can work until age 66. Our model does not include a cost of effort; therefore, the compensating variation is necessarily positive. But without taking a stand on the functional form for cost of effort, we can state that low interest rates generally increase the benefit of working longer, while low economywide wage growth reduces it. These results suggest that the presence of an endogenous labor supply and a cost of effort provide a stronger incentive to delay retirement in times of low interest rates and a weaker incentive in times of low wage growth.
| Retirement age | Baseline scenario a | Alternative scenarios | |||
|---|---|---|---|---|---|
| Low interest rate b (scenario 1) | Low economywide wage growth c (scenario 2) | Low interest rate and low economy- wide wage growth d (scenario 3) | Low individual wage growth e (scenario 4) | ||
| 62 | 48,843 | 57,945 | 44,660 | 52,998 | 44,506 |
| 63 | 47,110 | 56,863 | 42,670 | 51,410 | 42,438 |
| 64 | 45,403 | 55,861 | 40,660 | 50,033 | 40,428 |
| 65 | 43,796 | 54,935 | 38,781 | 48,543 | 38,550 |
| 66 | 42,058 | 53,759 | 36,877 | 47,152 | 36,569 |
| 67 | 40,498 | 52,876 | 35,104 | 45,649 | 34,873 |
| 68 | 38,838 | 51,751 | 33,297 | 44,254 | 33,011 |
| 69 | 37,143 | 50,609 | 31,555 | 42,868 | 31,290 |
| SOURCE: Authors' calculations using the methodology described in the Lifecycle Model section. | |||||
| NOTE: All scenarios assume 2.5 percent annual inflation. | |||||
| a. Annual real interest rate = 3.0 percent; AWI and WWI annual real growth rates = 3.5 percent. | |||||
| b. Annual real interest rate = 1.0 percent; AWI and WWI annual real growth rates = 3.5 percent. | |||||
| c. Annual real interest rate = 3.0 percent; AWI and WWI annual real growth rates = 2.5 percent. | |||||
| d. Annual real interest rate = 1.0 percent; AWI and WWI annual real growth rates = 2.5 percent. | |||||
| e. Annual real interest rate = 3.0 percent; AWI annual real growth rate = 3.5 percent; WWI annual real growth rate = 2.5 percent. | |||||
Table 4 repeats Table 3 except that the Social Security claiming age is constrained to be equal to the retirement age. Claiming upon retirement is a commonly observed behavior (Shoven, Slavov, and Wise 2018). Each cell in the table presents the compensating variation of being forced to both retire and claim at age t versus t+1. Thus, the marginal benefit of working longer incorporates any gains or losses from delaying Social Security. The values in Table 4 usually exceed the corresponding values in Table 3 for retirement (claiming) ages younger than the optimal claiming age.16 The values in Tables 3 and 4 are a direct measure of the relative value of working longer versus saving more (that is, having additional wealth).
| Retirement age | Baseline scenario a | Alternative scenarios | |||
|---|---|---|---|---|---|
| Low interest rate b (scenario 1) | Low economywide wage growth c (scenario 2) | Low interest rate and low economy-wide wage growth d (scenario 3) | Low individual wage growth e (scenario 4) | ||
| 62 | 50,026 | 63,589 | 45,856 | 58,366 | 45,631 |
| 63 | 46,992 | 60,822 | 42,463 | 55,037 | 42,403 |
| 64 | 48,334 | 64,596 | 43,417 | 58,171 | 43,295 |
| 65 | 45,004 | 61,260 | 39,954 | 54,559 | 39,686 |
| 66 | 41,781 | 57,928 | 36,554 | 50,863 | 36,328 |
| 67 | 41,444 | 59,018 | 36,014 | 51,529 | 35,818 |
| 68 | 38,192 | 55,428 | 32,695 | 47,712 | 32,302 |
| 69 | 34,923 | 51,635 | 29,403 | 43,749 | 29,048 |
| SOURCE: Authors' calculations using the methodology described in the Lifecycle Model section. | |||||
| NOTE: All scenarios assume 2.5 percent annual inflation. | |||||
| a. Annual real interest rate = 3.0 percent; AWI and WWI annual real growth rates = 3.5 percent. | |||||
| b. Annual real interest rate = 1.0 percent; AWI and WWI annual real growth rates = 3.5 percent. | |||||
| c. Annual real interest rate = 3.0 percent; AWI and WWI annual real growth rates = 2.5 percent. | |||||
| d. Annual real interest rate = 1.0 percent; AWI and WWI annual real growth rates = 2.5 percent. | |||||
| e. Annual real interest rate = 3.0 percent; AWI annual real growth rate = 3.5 percent; WWI annual real growth rate = 2.5 percent. | |||||
Economywide Wage Growth Versus Individual Wage Growth
As shown in Table 1, the adjustments required to respond to a reduction in economywide wage growth (scenario 2) are substantially larger than those needed for a reduction in individual wage growth (scenario 4). Table 2 shows that the two scenarios have correspondingly different effects on economic well-being. That large difference arises from the Social Security benefit formula and is driven by two factors. First, when there is a shock to individual wages but not to economywide wages, wage indexation does not change relative to the baseline; that is, the individual's earnings history is indexed to the same economywide level. Second, the bend points do not change relative to the baseline, but the individual's AIME level is lower relative to the bend points; thus, the progressivity of the benefit formula provides some insurance against the wage shock. Table 5 summarizes this contrast, showing AIME and PIA amounts in nominal dollars for 2027, when men born in 1965 reach age 62. In addition to the baseline scenario, the table shows results for alternative scenarios 2 (low economywide and individual wage growth) and 4 (low individual wage growth only). A shock to economywide wages lowers PIA by 6.78 percent, while a shock to individual wages alone lowers PIA by only 1.37 percent.
| Measure | Baseline scenario a | Alternative scenarios | |
|---|---|---|---|
| Low economywide wage growth b (scenario 2) | Low individual wage growth c (scenario 4) | ||
| AIME | 6,243 | 5,815 | 6,127 |
| PIA | 2,705 | 2,522 | 2,668 |
| PIA change from baseline (%) | . . . | -6.78 | -1.37 |
| SOURCE: Authors' calculations using the methodology described in the Lifecycle Model section. | |||
| NOTES: All scenarios assume retirement at age 65, a 2.5 percent annual inflation rate, and a 3.0 percent annual real interest rate.
. . . = not applicable.
|
|||
| a. AWI and WWI annual real growth rates = 3.5 percent. | |||
| b. AWI and WWI annual real growth rates = 2.5 percent. | |||
| c. AWI annual real growth rate = 3.5 percent; WWI annual real growth rate = 2.5 percent. | |||
Relationship to Financial Planning Advice
These lifecycle model results contrast with standard financial planning advice, which generally holds that lower interest rates require greater saving to meet income targets. The retirement planning process can be divided into three general steps. The first establishes a goal for retirement income. Typically, this goal is set as a fraction of preretirement income, such as 70 percent or 80 percent—a target replacement rate. The next step calculates the amount of assets needed at retirement to meet that income goal. Finally, with the selection of an assumed rate of interest, a saving plan can be constructed to achieve the target asset level at retirement.
Consider how this planning process is affected by a change in the real interest rate. If wage growth is assumed not to change, the goal for retirement income is also unchanged. Yet if one assumes a lower real interest rate, the amount of assets needed to fund this goal increases unambiguously. For instance, suppose the goal is to accumulate $100,000 after 10 years. With a 3 percent interest rate, $8,469 in annual saving is required. If interest rates fall to 1 percent, annual saving must increase to $9,463 to fund the $100,000 goal. That represents almost a 12 percent bump up in annual saving. Economists would generally look to prices of real annuities to estimate the cost increase of a particular level of retirement income. Given our framework, we estimate real annuity prices at age 65 for our stylized retiree as increasing from $15.09 per $1 of income when real rates are 3 percent to $18.57 per $1 of income when real rates are 1 percent. That represents a price increase of more than 23 percent.
Financial planners use a “4 percent” rule of thumb for spending down assets in retirement. The original rule prescribes spending of 4 percent of retirement assets in the first year of retirement, and then adjusting that spending level for inflation in each subsequent year. In the seminal work in the financial planning literature, Bengen (1994) analyzes historical returns and argues that investing in a 50/50 bond/stock portfolio could support the 4 percent rule's spending profile for at least 30 years. The 4 percent rule suggests that $25 in assets are needed for every $1 of retirement income. This is substantially higher than the annuity price for two reasons. First, an individual who follows the 4 percent rule does not benefit from mortality discounting; in fact, he or she often leaves substantial assets to heirs. Second, the 4 percent rule prescribes investing in risky assets and presumes that the payouts will be feasible even under worst-observed market conditions.
However, the financial planning community has also recognized that lower interest rates should translate into lower retirement spending. Finke, Pfau, and Blanchett (2013) consider how lower interest rates affect “safe portfolio withdrawal rates.” The authors state that “a 2.5% real withdrawal rate will result in an estimated 30-year failure rate of 10 percent.” If a 2.5 percent rule replaces the 4 percent rule, the price of $1 in retirement income rises to $40, a 60 percent increase. The authors recognize this dramatic increase and suggest that clients might want to consider annuity-type products: “Few clients will be satisfied spending such a small amount in retirement. It is possible to boost optimal withdrawal rates by incorporating assets that provide a mortality credit and longevity protection.”
By contrast, with the lifecycle approach, a change in interest rates is viewed as essentially a change in prices. In this case, the price of later consumption has gone up relative to the price of earlier consumption. Like all price changes, this leads to a wealth effect and a substitution effect. First, consider the wealth effect: Because wages are significantly higher than Social Security income, our stylized workers save early so that they can spend more later. The wealth effect of an interest rate decrease should lead workers to want to spend less in every period. How much less? Consider a simple model of planning with the goal of spending an equal amount each year in retirement. For our stylized worker born in 1965, we estimate an ability to spend $49,528 per year for life if interest rates are 3 percent. If interest rates decrease to 1 percent, however, the lifetime annual spending that can be supported by savings, wages, and Social Security drops by 9 percent to $45,021.
In turning to the substitution effect, we note that prices for late-life consumption significantly increase when interest rates decline. If interest rates change from 3 percent to 1 percent, the price of consumption at age 84 relative to consumption at age 54 increases by more than 80 percent! With such a change, we would expect substantial substitution away from late-life consumption. This is exactly what we observe in the lifecycle model. In the baseline case, our worker born in 1965 has arranged for a constant level of consumption throughout his lifetime of $49,528 per year. As described above, a change in the interest rate to 1 percent would imply that this person's lifetime wealth would support a constant annual consumption level of only $45,021. However, Table 1 shows that this is not the chosen strategy. Instead, the person chooses an initial spending level of $49,528 + $294 = $49,822. This is substantially higher than the constant-consumption solution, and in fact it even exceeds the initial spending rate. For the first year, the substitution effect is larger than the wealth effect. If the person survives to the maximum age of 110, planned consumption in that year drops to $49,528 − $14,977 = $34,551. Early consumption is costly relative to later consumption, so to shift to more consumption earlier in life, average annual consumption must fall; in this case, to $49,528 − $7,798 = $41,730.
The lifecycle model suggests two major departures from the financial planning approach. First, spending in retirement should not be held constant (whether to preretirement levels or to the same level in each year of retirement). Because dollars must be shifted from working years to retirement years, a lower interest rate reduces wealth and should generally push down spending in all years. Second, a lower interest rate significantly increases the relative price of consumption during retirement, which also pushes down optimal consumption in retirement. Saving levels are more ambiguous. The lifecycle model would support a strong argument against massive increases in preretirement saving levels. In addition, in some situations, initial saving levels would not increase at all. Because the price of current consumption is now relatively low, the substitution effect could outweigh the wealth effect and increase initial consumption, thereby decreasing saving levels.
Discussion and Conclusions
The main purpose of this article is to examine the consequences for late-career workers of assuming lower real interest rates, lower wage growth rates, or both, in the context of a standard lifecycle model. We think that this circumstance is relevant to many midcareer Americans who may have based retirement saving plans on initial assumptions made in the 1990s. At that time, safe interest rates were approximately 3 percent. Real interest rates have now been lower than 1 percent for a decade, and many forecasts suggest that they will remain between 0 percent and 1 percent in the medium to long run. So, there are good macroeconomic reasons why workers—particularly those in the later stages of their careers—might lower their assumed safe rate of return within a lifecycle plan. We investigate the consequences of reducing the real interest rate assumption from 3 percent to 1 percent.
The decision to lower the future wage growth assumption could be driven either by macroeconomic factors (such as the slowdown in the growth rate of average labor productivity) or by microeconomic factors. Chart 1 shows that the average mid- or late-career worker cannot expect real wage increases based on additional experience, as a much younger worker can. Some late-career workers undoubtedly have become more pessimistic about their future wage increases, and pessimistic late-career workers are probably more common in a time of slower economic growth. We investigate two wage-growth circumstances. In the first, projected wage growth is reduced both for the individual and for the economy as a whole. In the second, the newfound pessimism about wage growth applies only to the individual and not also to economywide average wage growth.
We reach several conclusions. First, the assumption by a midcareer worker of a reduced safe rate of return is equivalent to the assumption of a substantial decline in wealth (Table 2). This wealth effect lowers optimal consumption not only in retirement but also in the present, for the rest of the working career (Table 1). Second, future consumption becomes more expensive than current consumption if one assumes a lower real interest rate. This encourages a shift of consumption toward the present, leading to lower saving, at least initially. Third, the optimal age for single men to claim Social Security benefits advances from 68 to 70 if the real safe interest rate changes from 3 percent to 1 percent. Fourth, the incentive to defer retirement increases when interest rates are lower. Finally, all of these findings are contrary to standard financial advice, which often recommends saving significantly more in the face of lower rates of return. Standard financial advice aims to maintain a given standard of living in retirement, but a lifecycle model suggests that maintaining such a standard of living in retirement is not optimal if one is poorer in a lifetime sense and if future consumption has become relatively more expensive.
When late-career workers assume a lower rate of future wage growth, whether their more pessimistic outlook is for the economy as a whole or just for themselves makes a crucial difference. If they limit their scope to their own wage outlook, then Social Security provides them with an element of insurance. If they revise their final wage forecast downward by 20 percent, their projected Social Security benefits will also decline, but by far less than 20 percent. This cushions their loss in a compensating-variation sense (comparing scenarios 4 and 2 in Table 2) and cushions the decline in their optimal consumption path. On the other hand, Social Security offers no insurance against slower aggregate wage growth. In that case, if one's final wage is reduced by 20 percent because of an aggregate slowdown in wage growth, projected Social Security benefits will also fall by roughly 20 percent, and the Social Security replacement rate relative to final wages will be approximately unchanged.
The consequences of low returns and low wage growth on midcareer workers are not trivial, as our compensating-variation numbers indicate. However, financial planners who advocate saving substantially more in the face of these circumstances are not giving advice consistent with the optimal plan suggested by a lifecycle economic model.
Appendix A: Mathematical Presentation of the Lifecycle Model
Consider an individual who starts work at age 20 and might live to age 110 . The individual chooses real consumption in each period as well as an age at which to claim Social Security . Retirement age is exogenous; it is defined as the first year with no earnings. We assume that the retirement earnings test effectively requires that if . The real wage at time is and the risk-free real interest rate in period is . The real Social Security benefit received in each period is
where is the growth rate of benefits between period and and is the benefit that would be payable at age 62 based on earnings history . The calculation applies the Social Security benefit formula to the earnings history at time . For each year of delay between age 62 and benefit receipt, the benefit increases by . Note that benefits are updated each period to reflect any earnings after claiming.
The probability of surviving to period is . In our simulation, ; that is, survival beyond age 110 is impossible. We assume all assets are invested in actuarially fair annuities, and a $1 annuity contract pays a gross return of in period if and only if the individual is still alive. Because is the unconditional probability of surviving to period , is the probability of surviving to period conditional on having survived to period . Annuity markets are competitive, so the expected gross payout for the annuity seller must equal . Therefore, the period return on $1 used to purchase annuities is .17
We assume the individual is aged 54 in 2019. Starting in this base year , the individual is assumed to solve the following problem:
subject to
Here, is the consumption path, is the utility derived from period consumption,18 is an indicator function, is real assets carried into period , and is the discount rate. The constraint implies that borrowing is not allowed. The individual assumes a deterministic, constant future real interest rate and deterministic future path of wages . Under the baseline case, projections are in line with the average of past values for these variables. Under alternative scenarios, we lower the future real interest rate and wage growth rate and examine how these changes alter the model solutions. The initial level of assets is determined by using the same model to solve for the optimal plan of a 20-year-old using a historical series of wages and interest rates (through 2018), combined with the baseline future projections. We assume that the 20-year-old perfectly predicts the historical wage and interest rate series and (like the 54-year-old) assumes that these variables will follow their baseline paths thereafter. We set to optimal assets at age 54. Let be the maximized value of this problem given projected real interest rate , projected wages , and retirement age . In this setup, wages, Social Security benefits, and consumption are in real terms. However, Social Security benefits are calculated using nominal earnings, as described in the main text.
The effect on economic well-being of a change in and to and , respectively, is defined as in the following equation:
The term on the left represents lifetime utility under and when initial assets are . The term on the right represents lifetime utility under and , with the amount added to initial wealth. The amount thus represents the additional wealth needed to compensate the individual for the change from to and from to . Note that retirement age is held constant. This equation generates the results in Table 2.
The value of working 1 additional year, with real interest rate and real wage vector , is computed as from the following equation:
Here, is the compensating variation of being forced to retire at time instead of . It is a measure of the value of working an additional year. This equation generates the results in Table 3.
Notes
1 For a detailed description of the macroeconomics literature on r-star and the connections between r-star and economic growth, see Scott and others (2019).
2 In this article, we define “retirement” as the cessation of earnings.
3 Scott and others (2019) extend the analysis to include individuals in their 40s and find similar results for that group.
4 Because it is unclear whether the income effect or the substitution effect is greater, saving can either rise or fall. Empirical research on the interest elasticity of saving generally focuses on tax policy changes that alter the return on saving. There is little consensus in the empirical literature on whether an increase in the return on saving causes an increase in saving. Bernheim (2002), Attanasio and Wakefield (2010), and Friedman (2017) review the theories and the empirical literature. In our model, the substitution effect initially dominates the income effect. We aim to highlight that both effects are at play, which generates important differences between the lifecycle model and financial planning recommendations.
5 Attanasio and Weber (2010) provide a literature review.
6 Kotlikoff (2006) is one example of this discussion.
7 An individual may claim benefits after age 70, and a small fraction of claimants do so, but there is no actuarial advantage to the delay.
8 The earnings test requires beneficiaries who work to defer a fraction (up to 100 percent) of their benefits until FRA, with the fraction depending on the amount they earn.
9 The adjustment factors for claiming before FRA are given at https://www.ssa.gov/benefits/retirement/planner/1960.html. Benefits delayed beyond FRA increase by 8 percent of PIA per year (prorated monthly).
10 An alternative would be to compare two scenarios, one in which the baseline prevails throughout the individual's life and another in which the individual fully anticipates a shift to lower returns at age 55. In our model, individuals cannot plan in advance for this shift. If the shift were fully anticipated, individuals would adjust their plans starting at age 20 and would not need to reoptimize at age 55.
11 We would not expect results to be much different for single women or couples. However, those groups generally gain more by delaying Social Security (Shoven and Slavov 2014a, 2014b).
12 The subjective discount rate is a measure of impatience. It reflects the fact that, with all else equal, individuals would prefer to receive rewards sooner rather than later.
13 The Census Bureau conducts the CPS. The extracts are available at https://ceprdata.org/cps-uniform-data-extracts/.
14 The historical AWI is available at https://www.ssa.gov/oact/cola/AWI.html.
15 Our model treats individual preference parameters as fixed. In a general equilibrium context, changes in real interest rates and real wage growth rates must be driven by underlying changes in parameters. For example, changes in real interest rates could be driven by changes in subjective discount rates or risk aversion. A general equilibrium analysis is beyond the scope of this article. For the purposes of individual decision making, we believe it is reasonable to separate preferences from the general equilibrium context. The working paper on which this article is based (Scott and others 2019) also considers scenarios in which the subjective discount rate declines in line with the interest rate. The addition of those scenarios did not change the main conclusions presented in this article.
16 However, some Table 3 values are greater because of nonlinearity in the actuarial adjustment.
17 In reality, actuarially fair annuities may not be available. We would not expect this to alter our main conclusions. However, the presence of actuarially fair annuities may reduce one of the advantages of delaying Social Security benefits, as doing so is, in effect, a way to purchase actuarially generous annuities.
18 We analyze power utility with risk parameter equal to 3.
References
Attanasio, Orazio P., and Matthew Wakefield. 2010. “The Effects on Consumption and Saving of Taxing Asset Returns.” In Dimensions of Tax Design: The Mirrlees Review, edited by Stuart Adam, Timothy Besley, Richard Blundell, Stephen Bond, Robert Chote, Malcolm Gammie, Paul Johnson, Gareth Myles, and James Poterba (675–736). New York, NY: Oxford University Press.
Attanasio, Orazio P., and Guglielmo Weber. 2010. “Consumption and Saving: Models of Intertemporal Allocation and Their Implications for Public Policy.” Journal of Economic Literature 48(3): 693–751.
Bengen, William P. 1994. “Determining Withdrawal Rates Using Historical Data.” Journal of Financial Planning 7(4): 171–180.
Bernheim, B. Douglas. 2002. “Taxation and Saving.” In Handbook of Public Economics, Volume 3, edited by Alan J. Auerbach and Martin Feldstein (1173–1249). Amsterdam: Elsevier Science B.V.
Bronshtein, Gila, Jason Scott, John B. Shoven, and Sita Nataraj Slavov. 2019. “The Power of Working Longer.” Journal of Pension Economics and Finance 18(4): 623–644.
Carroll, Christopher D. 1997. “Buffer-Stock Saving and the Life Cycle/Permanent Income Hypothesis.” The Quarterly Journal of Economics 112(1): 1–55.
———. 2009. “Precautionary Saving and the Marginal Propensity to Consume out of Permanent Income.” Journal of Monetary Economics 56(6): 780–790.
Coile, Courtney, Peter Diamond, Jonathan Gruber, and Alain Jousten. 2002. “Delays in Claiming Social Security Benefits.” Journal of Public Economics 84(3): 357–385.
Deaton, Angus. 1991. “Saving and Liquidity Constraints.” Econometrica 59(5): 1221–1248.
Department of the Treasury. 2020. “Interest Rate Statistics: Daily Treasury Real Yield Curve Rates.” https://www.treasury.gov/resource-center/data-chart-center/interest-rates/Pages/TextView.aspx?data=realyieldAll.
Finke, Michael S., Wade D. Pfau, and David M. Blanchett. 2013. “The 4 Percent Rule Is Not Safe in a Low-Yield World.” Journal of Financial Planning 26(6): 46–55.
Friedman, John N. 2017. “Tax Policy and Retirement Savings.” In The Economics of Tax Policy, edited by Alan J. Auerbach and Kent Smetters (299–334). New York, NY: Oxford University Press.
Friedman, Milton. 1957. A Theory of the Consumption Function. Princeton, NJ: Princeton University Press.
Gustman, Alan L., and Thomas Steinmeier. 2008. “How Changes in Social Security Affect Recent Retirement Trends.” NBER Working Paper No. 14105. Cambridge, MA: National Bureau of Economic Research.
———. 2015. “Effects of Social Security Policies on Benefit Claiming, Retirement and Saving.” Journal of Public Economics 129: 51–62.
Haan, Peter, and Victoria Prowse. 2014. “Longevity, Life-Cycle Behavior and Pension Reform.” Journal of Econometrics 178(3): 582–601.
Horneff, Vanya, Raimond Maurer, and Olivia S. Mitchell. 2018. “How Persistent Low Expected Returns Alter Optimal Life Cycle Saving, Investment, and Retirement Behavior.” In How Persistent Low Returns Will Shape Saving and Retirement, edited by Olivia S. Mitchell, Robert Clark, and Raimond Maurer (119–131). New York, NY: Oxford University Press.
Kotlikoff, Laurence J. 2006. “Is Conventional Financial Planning Good for Your Financial Health?” http://people.bu.edu/kotlikof/Financial%20Health%201-11-061.pdf.
Kotlikoff, Laurence J., Philip Moeller, and Paul Solman. 2015. Get What's Yours: The Secrets to Maxing Out Your Social Security. New York, NY: Simon & Schuster.
Laubach, Thomas, and John C. Williams. 2003. “Measuring the Natural Rate of Interest.” Review of Economics and Statistics 85(4): 1063–1070.
———. 2015. “Measuring the Natural Rate of Interest Redux.” Federal Reserve Bank of San Francisco Working Paper No. 2015-16. San Francisco, CA: Federal Reserve Bank of San Francisco.
Mahaney, James I., and Peter C. Carlson. 2007. “Rethinking Social Security Claiming in a 401(k) World.” PRC Working Paper No. 2007-18. Philadelphia, PA: Pension Research Council, University of Pennsylvania Wharton School.
Meyer, William, and William Reichenstein. 2010. “Social Security: When to Start Benefits and How to Minimize Longevity Risk.” Journal of Financial Planning 23(3): 49–59.
Modigliani, Franco. 1966. “The Life Cycle Hypothesis of Saving, the Demand for Wealth and the Supply of Capital.” Social Research 33(2): 160–217.
Munnell, Alicia H., and Mauricio Soto. 2005. “Why Do Women Claim Social Security Benefits So Early?” Issue in Brief No. 35. Chestnut Hill, MA: Center for Retirement Research at Boston College. http://crr.bc.edu/wp-content/uploads/2005/10/ib_35_508c.pdf.
Sass, Steven A., Wei Sun, and Anthony Webb. 2007. “Why Do Married Men Claim Social Security Benefits So Early? Ignorance or Caddishness?” Working Paper No. 2007-17. Chestnut Hill, MA: Center for Retirement Research at Boston College. https://crr.bc.edu/working-papers/why-do-married-men-claim-social-security-benefits-so-early-ignorance-or-caddishness/.
———. 2013. “Social Security Claiming Decision of Married Men and Widow Poverty.” Economics Letters 119(1): 20–23.
Schmitt, John. 2003. “Creating a Consistent Hourly Wage Series from the Current Population Survey's Outgoing Rotation Group, 1979–2002.” Washington, DC: Center for Economic Policy Research. http://ceprdata.org/wp-content/cps/CEPR_ORG_Wages.pdf.
Scholz, John Karl, and Ananth Seshadri. 2009. “What Replacement Rates Should Households Use?” MRRC Working Paper No. 2009-214. Ann Arbor, MI: University of Michigan Retirement Research Center.
Scott, Jason, John B. Shoven, Sita Slavov, and John G. Watson. 2019. “Retirement Implications of a Low Wage Growth, Low Real Interest Rate Economy.” NBER Working Paper No. 25556. Cambridge, MA: National Bureau of Economic Research. https://www.nber.org/papers/w25556.
Shefrin, Hersh M., and Richard H. Thaler. 1988. “The Behavioral Life-Cycle Hypothesis.” Economic Inquiry 26(4): 609–643.
Shoven, John B., and Sita Nataraj Slavov. 2014a. “Does It Pay to Delay Social Security?” Journal of Pension Economics & Finance 13(2): 121–144.
———. 2014b. “Recent Changes in the Gains from Delaying Social Security.” Journal of Financial Planning 27(3): 32–41.
Shoven, John B., Sita Nataraj Slavov, and David A. Wise. 2018. “Social Security Claiming Decisions: Survey Evidence.” Journal of Financial Planning 31(11): 35–47.