Longevity Visualizer
The Social Security Administration's Office of the Chief Actuary (OCACT) produces cohort life tables that project the fraction of the population born in a given calendar year that will remain alive at each annual age in the future as well as the probability of death. Using OCACT's cohort life tables, we have created the Longevity Visualizer (LV), an interactive data-visualization tool.
User Agreement: The user explicitly acknowledges that all shareware obtained from this site is provided 'as is' without warranty of any kind, expressed or implied, including, but not limited to the warranties of merchantability and fitness for a particular purpose and that the risk of using shareware obtained from this site, including the entire costs of all necessary remedies, is with that user.
Download LV-Install.zip (22 MB, updated May 13, 2016)
Download User's Guide (20 KB)
NOTE: The Longevity Visualizer is a Windows-only, standalone software application. No Mac OS version is available.
The installation file is contained within a WinZip file for safe downloading.
- Right-click on the LV-Install.zip link above and choose "Save Target As" (or similar option) to download the WinZip file.
- On your computer, double-click on LV-Install.zip to open it. You will see that it contains one file named LV-Install.exe. Double-click on LV-Install.exe to start the LV installation program. [You do not have to extract the LV-Install.exe from the WinZip to start the installation.]
- Follow the steps of the InstallShield Wizard to complete the installation.
- After installation, you can run the LV from the new shortcut icon on your desktop or from your Start menu under All Programs > US Social Security Administration > Longevity Visualizer.
- To uninstall the application, choose “Uninstall Longevity Visualizer” from the Start menu folder.
Further Details
- The Longevity Visualizer: An Analytic Tool for Exploring the Cohort Mortality Data Produced by the Office of the Chief Actuary, by Brian J. Alleva
Related Content
- 2015 Trustees Report
- Life Tables for the United States Social Security Area 1900–2100, by Felicitie C. Bell and Michael L. Miller
- OCACT Life Expectancy Calculator
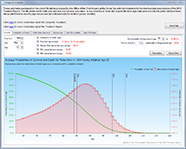
Sample screen shots
Contact
Version History
- May 13, 2016: Revised wording in Gender Gap tab
- May 6, 2016: Original release